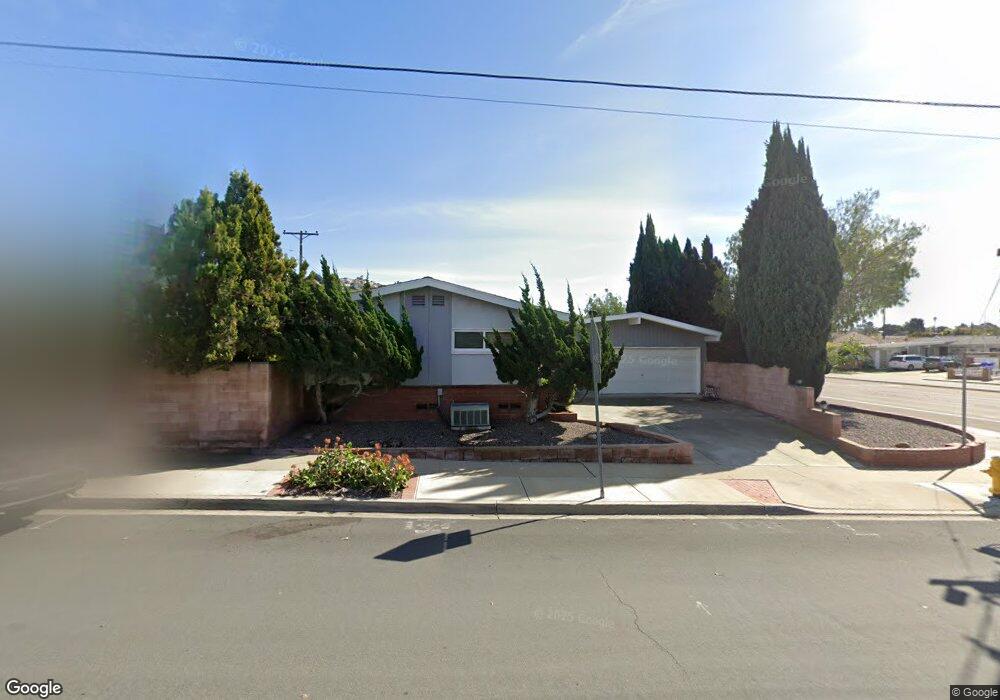
5602 Waring Rd San Diego, CA 92120
Allied Gardens NeighborhoodEstimated Value: $872,044 - $984,000
4
Beds
2
Baths
1,174
Sq Ft
$780/Sq Ft
Est. Value
About This Home
This home is located at 5602 Waring Rd, San Diego, CA 92120 and is currently estimated at $915,511, approximately $779 per square foot. 5602 Waring Rd is a home located in San Diego County with nearby schools including Marvin Elementary School, Lewis Middle School, and Patrick Henry High School.
Ownership History
Date
Name
Owned For
Owner Type
Purchase Details
Closed on
Nov 9, 2015
Sold by
Lower Francine S and Lower Tedd W
Bought by
The Roger & Catherine Jaffe and Jaffe Catherine L
Current Estimated Value
Purchase Details
Closed on
Aug 14, 2009
Sold by
Lower Francine S and Lower Tedd W
Bought by
Lower Francine S and Lower Tedd W
Purchase Details
Closed on
Jun 2, 2003
Sold by
Stevenson F S
Bought by
Lower Tedd and Stevenson F S
Home Financials for this Owner
Home Financials are based on the most recent Mortgage that was taken out on this home.
Original Mortgage
$203,700
Interest Rate
5.71%
Mortgage Type
Purchase Money Mortgage
Purchase Details
Closed on
Oct 22, 1998
Sold by
Vilott Harry D and Vilott Virginia L
Bought by
Stevenson F S
Home Financials for this Owner
Home Financials are based on the most recent Mortgage that was taken out on this home.
Original Mortgage
$180,765
Interest Rate
6.6%
Mortgage Type
VA
Purchase Details
Closed on
Jan 17, 1996
Sold by
Olive Evelyn Smith Trust and Lattizzori Denise
Bought by
Smith Leonard Lee
Create a Home Valuation Report for This Property
The Home Valuation Report is an in-depth analysis detailing your home's value as well as a comparison with similar homes in the area
Home Values in the Area
Average Home Value in this Area
Purchase History
| Date | Buyer | Sale Price | Title Company |
|---|---|---|---|
| The Roger & Catherine Jaffe | $452,500 | California Title Company | |
| Lower Francine S | -- | None Available | |
| Lower Tedd | -- | First American | |
| Stevenson F S | $175,500 | First American Title Co | |
| Smith Leonard Lee | -- | -- |
Source: Public Records
Mortgage History
| Date | Status | Borrower | Loan Amount |
|---|---|---|---|
| Previous Owner | Lower Tedd | $203,700 | |
| Previous Owner | Stevenson F S | $180,765 |
Source: Public Records
Tax History Compared to Growth
Tax History
| Year | Tax Paid | Tax Assessment Tax Assessment Total Assessment is a certain percentage of the fair market value that is determined by local assessors to be the total taxable value of land and additions on the property. | Land | Improvement |
|---|---|---|---|---|
| 2025 | $6,484 | $535,658 | $305,222 | $230,436 |
| 2024 | $6,484 | $525,156 | $299,238 | $225,918 |
| 2023 | $6,341 | $514,860 | $293,371 | $221,489 |
| 2022 | $6,173 | $504,766 | $287,619 | $217,147 |
| 2021 | $6,131 | $494,870 | $281,980 | $212,890 |
| 2020 | $6,056 | $489,797 | $279,089 | $210,708 |
| 2019 | $5,949 | $480,194 | $273,617 | $206,577 |
| 2018 | $5,562 | $470,779 | $268,252 | $202,527 |
| 2017 | $5,430 | $461,549 | $262,993 | $198,556 |
| 2016 | $5,343 | $452,500 | $257,837 | $194,663 |
| 2015 | $2,636 | $228,915 | $130,437 | $98,478 |
| 2014 | $2,594 | $224,431 | $127,882 | $96,549 |
Source: Public Records
Map
Nearby Homes
- 6994 Carthage St
- 7173 Eldridge St
- 5461 Brunswick Ave
- 5946 Crow Ct
- 7232 Margerum Ave
- 7414 Margerum Ave
- 6817 Birchwood St
- 7427 Margerum Ave
- 5424 Princess View Place
- 6642 Eldridge St
- 5214 Lewison Place
- 6221 Brynwood Ct
- 6329 Caminito Estrellado
- 6615 Ridge Manor Ave
- 5125 Fontaine St Unit 205
- 5125 Fontaine St Unit 105
- 7740 Margerum Ave Unit 204
- 6183 Rockhurst Dr
- 6436 Rancho Park Dr
- 6346 Ridge Manor Ave
- 5602 Waring Rd
- 5612 Waring Rd
- 5601 Brunswick Ave
- 5624 Waring Rd Unit 6
- 5611 Brunswick Ave
- 5592 Waring Rd
- 5623 Brunswick Ave
- 5597 Brunswick Ave
- 5636 Waring Rd
- 5582 Waring Rd
- 5635 Brunswick Ave
- 5601 Waring Rd
- 5593 Brunswick Ave
- 5611 Waring Rd
- 5648 Waring Rd
- 5623 Waring Rd
- 7051 Eldridge St
- 5572 Waring Rd
- 5591 Waring Rd
- 5647 Brunswick Ave