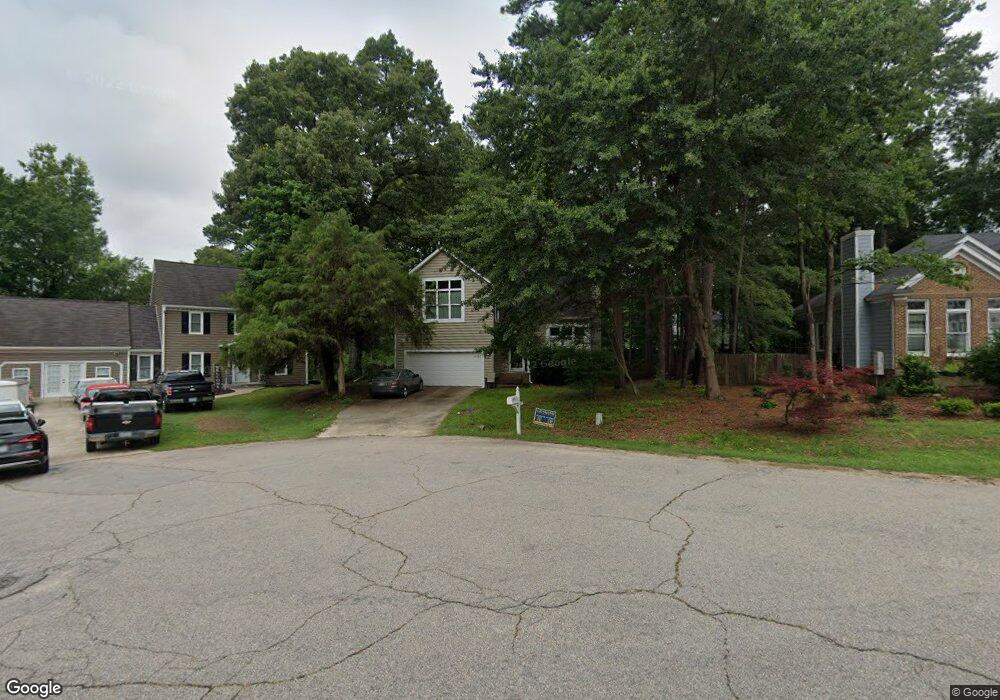
5605 Blacket Ct Raleigh, NC 27604
Estimated Value: $342,995 - $383,000
3
Beds
3
Baths
1,717
Sq Ft
$211/Sq Ft
Est. Value
About This Home
This home is located at 5605 Blacket Ct, Raleigh, NC 27604 and is currently estimated at $361,499, approximately $210 per square foot. 5605 Blacket Ct is a home located in Wake County with nearby schools including Beaverdam Elementary School, River Bend Middle, and Knightdale High.
Ownership History
Date
Name
Owned For
Owner Type
Purchase Details
Closed on
Mar 27, 2007
Sold by
Spacek Kevin B and Spacek Lori Christine
Bought by
Saha Soma
Current Estimated Value
Home Financials for this Owner
Home Financials are based on the most recent Mortgage that was taken out on this home.
Original Mortgage
$171,900
Outstanding Balance
$104,335
Interest Rate
6.22%
Mortgage Type
Purchase Money Mortgage
Estimated Equity
$257,164
Purchase Details
Closed on
Feb 7, 2003
Sold by
Spacek Kevin B and Fiumano Lori Christine
Bought by
Spacek Kevin B and Spacek Lori Christine
Home Financials for this Owner
Home Financials are based on the most recent Mortgage that was taken out on this home.
Original Mortgage
$113,600
Interest Rate
4.75%
Purchase Details
Closed on
Jan 14, 1999
Sold by
Taylor Jeffrey B
Bought by
Spacek Kevin B and Fiumang Lori Christine
Home Financials for this Owner
Home Financials are based on the most recent Mortgage that was taken out on this home.
Original Mortgage
$120,765
Interest Rate
6.72%
Create a Home Valuation Report for This Property
The Home Valuation Report is an in-depth analysis detailing your home's value as well as a comparison with similar homes in the area
Home Values in the Area
Average Home Value in this Area
Purchase History
| Date | Buyer | Sale Price | Title Company |
|---|---|---|---|
| Saha Soma | $172,000 | None Available | |
| Spacek Kevin B | -- | -- | |
| Spacek Kevin B | $124,500 | -- |
Source: Public Records
Mortgage History
| Date | Status | Borrower | Loan Amount |
|---|---|---|---|
| Open | Saha Soma | $171,900 | |
| Previous Owner | Spacek Kevin B | $113,600 | |
| Previous Owner | Spacek Kevin B | $120,765 | |
| Closed | Spacek Kevin B | $21,000 |
Source: Public Records
Tax History
| Year | Tax Paid | Tax Assessment Tax Assessment Total Assessment is a certain percentage of the fair market value that is determined by local assessors to be the total taxable value of land and additions on the property. | Land | Improvement |
|---|---|---|---|---|
| 2025 | $1,841 | $284,675 | $80,000 | $204,675 |
| 2024 | $1,788 | $284,675 | $80,000 | $204,675 |
Source: Public Records
Map
Nearby Homes
- 5512 Grand Traverse Dr
- 5436 Grand Traverse Dr
- 1953 Castle Pines Dr
- 2203 Whistling Straits Way
- 2029 Castle Pines Dr
- 1502 Oakland Hills Way
- 1620 Oakland Hills Way
- 1928 Shadow Glen Dr
- 2025 Haig Point Way
- 1968 Glen Hollow Dr
- 2330 Lazy River Dr
- 2331 Whistling Straits Way
- 1421 Justice Union Ct
- 1638 Oakland Hills Way
- 2279 Lazy River Dr
- 1944 Talamore Ct
- 2215 Turtle Point Dr
- 1701 Point Owoods Ct
- 5335 Big Bass Dr
- 5351 Cog Hill Ct
- 5601 Blacket Ct
- 5609 Blacket Ct
- 5600 Torness Ct
- 5600 Blacket Ct
- 1121 Penselwood Dr
- 1125 Penselwood Dr
- 5612 Blacket Ct
- 5604 Blacket Ct
- 5608 Blacket Ct
- 5601 Torness Ct
- 5616 Torness Ct
- 1113 Penselwood Dr
- 5605 Torness Ct
- 1109 Penselwood Dr
- 1120 Penselwood Dr
- 5609 Torness Ct
- 1124 Penselwood Dr
- 5613 Torness Ct
- 1116 Penselwood Dr
- 1128 Penselwood Dr
Your Personal Tour Guide
Ask me questions while you tour the home.