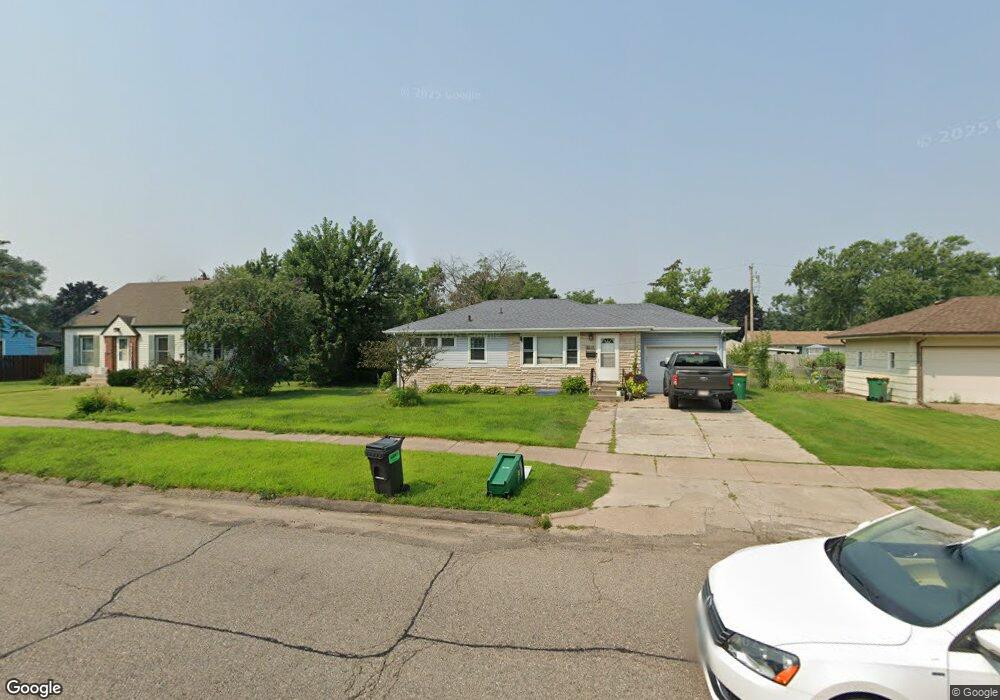
5605 Humboldt Ave N Minneapolis, MN 55430
Lions NeighborhoodEstimated Value: $273,994 - $293,000
4
Beds
2
Baths
912
Sq Ft
$310/Sq Ft
Est. Value
About This Home
This home is located at 5605 Humboldt Ave N, Minneapolis, MN 55430 and is currently estimated at $282,499, approximately $309 per square foot. 5605 Humboldt Ave N is a home located in Hennepin County with nearby schools including Brooklyn Center Elementary STEAM, Progeny Academy, and Bright Water MontessoriSchool.
Ownership History
Date
Name
Owned For
Owner Type
Purchase Details
Closed on
Jan 4, 2016
Sold by
Oronax Properties Llc
Bought by
Chepetia Maritza Cortes
Current Estimated Value
Home Financials for this Owner
Home Financials are based on the most recent Mortgage that was taken out on this home.
Original Mortgage
$147,181
Outstanding Balance
$116,710
Interest Rate
3.87%
Mortgage Type
FHA
Estimated Equity
$165,789
Purchase Details
Closed on
Jun 30, 2009
Sold by
Oronax Properties Llc
Bought by
Cindy Ponka and Wolf Michael
Home Financials for this Owner
Home Financials are based on the most recent Mortgage that was taken out on this home.
Original Mortgage
$160,000
Interest Rate
8%
Mortgage Type
Land Contract Argmt. Of Sale
Purchase Details
Closed on
Oct 21, 2008
Sold by
Deutsche Bank
Bought by
Bauer Services Inc
Purchase Details
Closed on
Oct 28, 2003
Sold by
Hamza Meaz A and Mohammed Badriya A
Bought by
Yang Marina and Vang Vue
Purchase Details
Closed on
Dec 3, 1999
Sold by
King Hazel
Bought by
Hamza Meaz A and Mohammed Badriya A
Create a Home Valuation Report for This Property
The Home Valuation Report is an in-depth analysis detailing your home's value as well as a comparison with similar homes in the area
Home Values in the Area
Average Home Value in this Area
Purchase History
| Date | Buyer | Sale Price | Title Company |
|---|---|---|---|
| Chepetia Maritza Cortes | $149,900 | First American Title Co | |
| Cindy Ponka | $160,000 | -- | |
| Bauer Services Inc | $56,000 | -- | |
| Yang Marina | $170,000 | -- | |
| Hamza Meaz A | $107,000 | -- |
Source: Public Records
Mortgage History
| Date | Status | Borrower | Loan Amount |
|---|---|---|---|
| Open | Chepetia Maritza Cortes | $147,181 | |
| Previous Owner | Cindy Ponka | $160,000 |
Source: Public Records
Tax History Compared to Growth
Tax History
| Year | Tax Paid | Tax Assessment Tax Assessment Total Assessment is a certain percentage of the fair market value that is determined by local assessors to be the total taxable value of land and additions on the property. | Land | Improvement |
|---|---|---|---|---|
| 2024 | $3,282 | $224,200 | $66,000 | $158,200 |
| 2023 | $3,097 | $213,900 | $54,000 | $159,900 |
| 2022 | $2,749 | $229,000 | $76,000 | $153,000 |
| 2021 | $2,903 | $196,000 | $63,000 | $133,000 |
| 2020 | $2,643 | $182,000 | $56,000 | $126,000 |
| 2019 | $2,853 | $167,000 | $50,000 | $117,000 |
| 2018 | $2,420 | $171,000 | $46,000 | $125,000 |
| 2017 | $1,949 | $133,000 | $33,000 | $100,000 |
| 2016 | $2,783 | $135,300 | $38,000 | $97,300 |
| 2015 | $6,988 | $123,200 | $34,100 | $89,100 |
| 2014 | -- | $102,300 | $32,600 | $69,700 |
Source: Public Records
Map
Nearby Homes
- 5706 Girard Ave N
- 5524 Humboldt Ave N
- 5527 Fremont Ave N
- 5715 Emerson Ave N
- 5557 Logan Ave N
- 5842 James Ave N
- 5344 Girard Ave N
- 5637 Bryant Ave N
- 5500 Bryant Ave N
- 6000 Girard Ave N
- 5239 Humboldt Ave N
- 5307 Newton Ave N
- 5135 Irving Ave N
- 5118 James Ave N
- 6100 Colfax Ave N
- 5101 Fremont Ave N
- 5146 Newton Ave N
- 5225 N 6th St
- 5252 Queen Ave N
- 5253 Queen Ave N
- 5615 Humboldt Ave N
- 5563 Humboldt Ave N
- 5600 Irving Ave N
- 5606 Irving Ave N
- 5555 Humboldt Ave N
- 5621 Humboldt Ave N
- 5542 Irving Ave N
- 5536 Irving Ave N
- 5612 Irving Ave N
- 5606 Humboldt Ave N
- 5610 Humboldt Ave N
- 5633 Humboldt Ave N
- 5620 Humboldt Ave N
- 5568 Humboldt Ave N
- 5618 Irving Ave N
- 5530 Irving Ave N
- 5624 Humboldt Ave N
- 5601 Irving Ave N
- 5639 Humboldt Ave N
- 5554 Humboldt Ave N