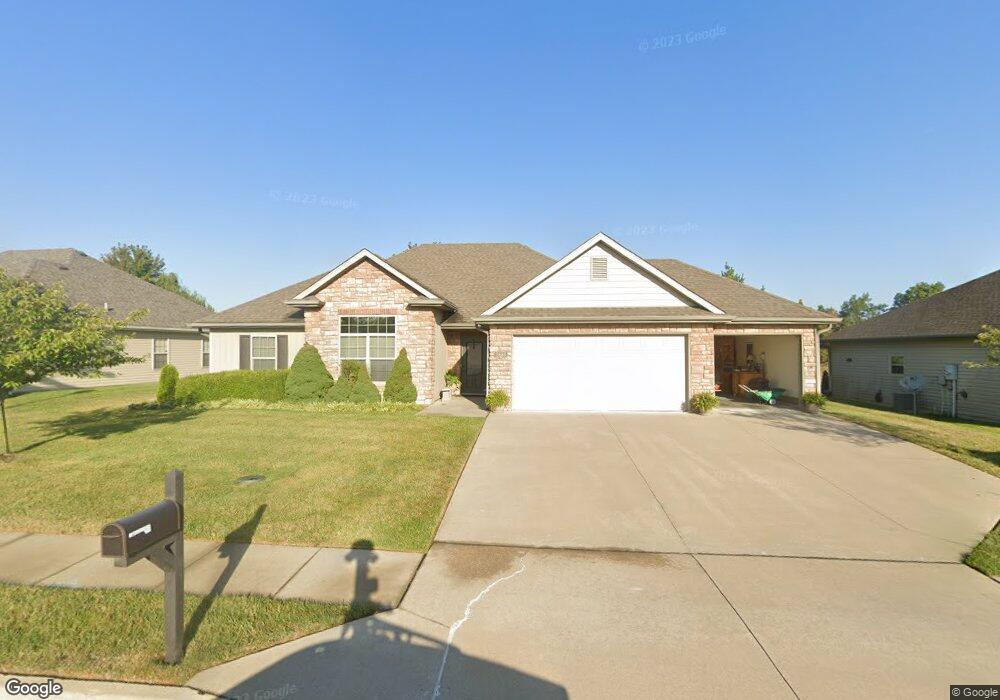
5605 Lantermans Mill Dr Columbia, MO 65203
Estimated Value: $359,985 - $388,000
3
Beds
2
Baths
1,691
Sq Ft
$219/Sq Ft
Est. Value
About This Home
This home is located at 5605 Lantermans Mill Dr, Columbia, MO 65203 and is currently estimated at $370,328, approximately $218 per square foot. 5605 Lantermans Mill Dr is a home located in Boone County with nearby schools including Mill Creek Elementary School, Ann Hawkins Gentry Middle School, and Rock Bridge High School.
Ownership History
Date
Name
Owned For
Owner Type
Purchase Details
Closed on
Jun 30, 2009
Sold by
Robert Akin Construction & Design Llc
Bought by
Neier Ivan K and Neier Patricia B
Current Estimated Value
Home Financials for this Owner
Home Financials are based on the most recent Mortgage that was taken out on this home.
Original Mortgage
$153,400
Outstanding Balance
$97,648
Interest Rate
4.83%
Mortgage Type
Purchase Money Mortgage
Estimated Equity
$272,680
Purchase Details
Closed on
Mar 10, 2009
Sold by
Mill Creek Manor Inc
Bought by
Robert Akin Construction & Design Llc
Home Financials for this Owner
Home Financials are based on the most recent Mortgage that was taken out on this home.
Original Mortgage
$160,650
Interest Rate
5.13%
Mortgage Type
Construction
Create a Home Valuation Report for This Property
The Home Valuation Report is an in-depth analysis detailing your home's value as well as a comparison with similar homes in the area
Purchase History
| Date | Buyer | Sale Price | Title Company |
|---|---|---|---|
| Neier Ivan K | -- | Boone Central Title Company | |
| Robert Akin Construction & Design Llc | -- | Boone Central Title Company |
Source: Public Records
Mortgage History
| Date | Status | Borrower | Loan Amount |
|---|---|---|---|
| Open | Neier Ivan K | $153,400 | |
| Previous Owner | Robert Akin Construction & Design Llc | $160,650 |
Source: Public Records
Tax History
| Year | Tax Paid | Tax Assessment Tax Assessment Total Assessment is a certain percentage of the fair market value that is determined by local assessors to be the total taxable value of land and additions on the property. | Land | Improvement |
|---|---|---|---|---|
| 2025 | $2,541 | $43,092 | $7,220 | $35,872 |
| 2024 | $2,539 | $37,639 | $7,220 | $30,419 |
| 2023 | $2,518 | $37,639 | $7,220 | $30,419 |
| 2022 | $2,329 | $34,846 | $7,220 | $27,626 |
| 2021 | $2,333 | $34,846 | $7,220 | $27,626 |
| 2020 | $2,387 | $33,497 | $7,220 | $26,277 |
| 2019 | $2,387 | $33,497 | $7,220 | $26,277 |
| 2018 | $2,404 | $0 | $0 | $0 |
| 2017 | $2,375 | $33,497 | $7,220 | $26,277 |
| 2016 | $2,371 | $33,497 | $7,220 | $26,277 |
| 2015 | $2,177 | $33,497 | $7,220 | $26,277 |
| 2014 | $2,184 | $33,497 | $7,220 | $26,277 |
Source: Public Records
Map
Nearby Homes
- 3400 Wisteria Ln
- 3003 Cornelia Ln
- 5201 Buttercup Dr
- 5205 Buttercup Dr
- 5305 Buttercup Dr
- 5303 Flatts Mill Ct
- 5309 Buttercup Dr
- 5208 Buttercup Dr
- 2822 Misty Flower Dr
- 2816 Misty Flower Dr
- 5321 Spartina Ln
- 5325 Spartina Ln
- 2805 Misty Flower Dr
- 2829 Misty Flower Dr
- 2728 Misty Flower Dr
- 5301 Stormy Dr
- 5305 Stormy Dr
- LOT 1124 Stormy Dr
- 5308 Whisper Dr
- 5228 Whisper Dr
- 5607 Lantermans Mill Dr
- 5603 Lantermans Mill Dr
- 5609 Lantermans Mill Dr
- 3211 Ballard Mill Dr
- 3202 Funderburg Mill Dr
- 3204 Funderburg Mill Dr
- 3212 Ballard Mill Dr
- 5611 Lanterman's Mill Dr
- 5611 Lantermans Mill Dr Unit LOT 243
- 5611 Lantermans Mill Dr
- 3209 Ballard Mill Dr
- 3114 Funderburg Mill Dr
- 3313 Crabapple Ln
- 3210 Ballard Mill Dr
- 3112 Funderburg Mill Dr
- 3311 Crabapple Ln
- 3201 Funderburg Mill Dr
- 3208 Ballard Mill Dr
- 3203 Funderburg Mill Dr
- 3110 Funderburg Mill Dr
Your Personal Tour Guide
Ask me questions while you tour the home.