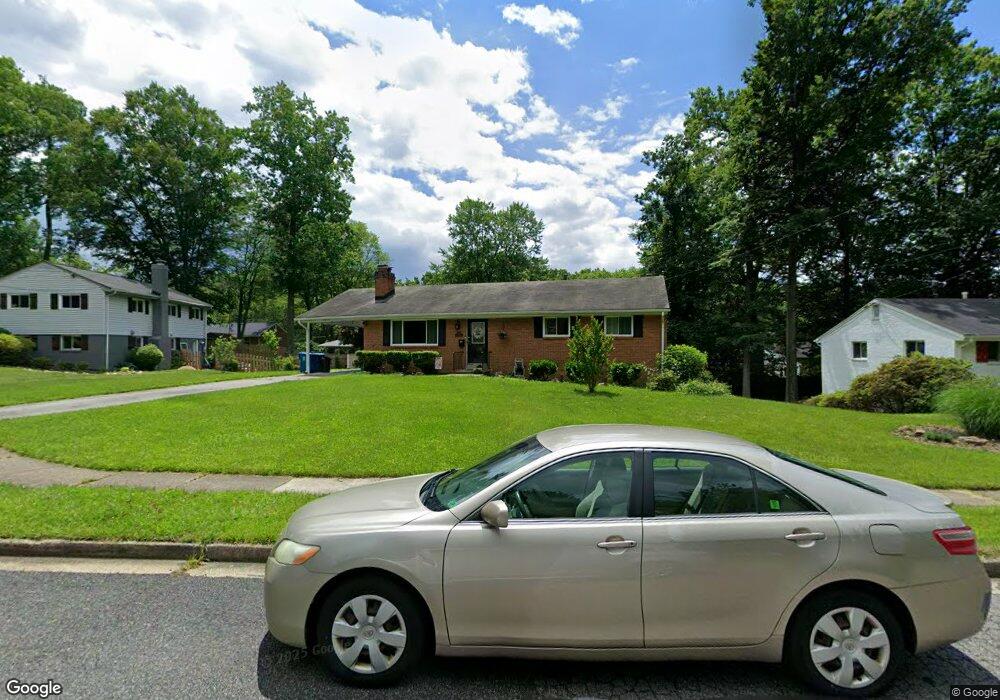
5605 Viceroy Ct Springfield, VA 22151
Estimated Value: $703,618 - $726,000
4
Beds
3
Baths
1,260
Sq Ft
$567/Sq Ft
Est. Value
About This Home
This home is located at 5605 Viceroy Ct, Springfield, VA 22151 and is currently estimated at $713,905, approximately $566 per square foot. 5605 Viceroy Ct is a home located in Fairfax County with nearby schools including North Springfield Elementary School, Holmes Middle School, and Annandale High School.
Ownership History
Date
Name
Owned For
Owner Type
Purchase Details
Closed on
May 28, 2008
Sold by
Bank Of New York As Trust
Bought by
Labniouri Maher and Amra,Mona
Current Estimated Value
Home Financials for this Owner
Home Financials are based on the most recent Mortgage that was taken out on this home.
Original Mortgage
$279,000
Outstanding Balance
$177,748
Interest Rate
5.91%
Mortgage Type
New Conventional
Estimated Equity
$536,157
Purchase Details
Closed on
Aug 29, 2005
Sold by
Cole Charles J
Bought by
Pineda Gloria
Home Financials for this Owner
Home Financials are based on the most recent Mortgage that was taken out on this home.
Original Mortgage
$440,000
Interest Rate
5.68%
Mortgage Type
New Conventional
Purchase Details
Closed on
Oct 31, 1997
Sold by
Thompson Clifford V and Thompson Lorraine S
Bought by
Cole Charles J and Cole Cheryl K
Home Financials for this Owner
Home Financials are based on the most recent Mortgage that was taken out on this home.
Original Mortgage
$173,400
Interest Rate
7.31%
Mortgage Type
VA
Create a Home Valuation Report for This Property
The Home Valuation Report is an in-depth analysis detailing your home's value as well as a comparison with similar homes in the area
Home Values in the Area
Average Home Value in this Area
Purchase History
We collect this data history from publicly available records. To have your information removed, we recommend requesting removal directly through your county’s website.
| Date | Buyer | Sale Price | Title Company |
|---|---|---|---|
| Labniouri Maher | $310,000 | -- | |
| Pineda Gloria | $550,000 | -- | |
| Cole Charles J | $179,000 | -- |
Source: Public Records
Mortgage History
We collect this data history from publicly available records. To have your information removed, we recommend requesting removal directly through your county’s website.
| Date | Status | Borrower | Loan Amount |
|---|---|---|---|
| Open | Labniouri Maher | $279,000 | |
| Previous Owner | Pineda Gloria | $440,000 | |
| Previous Owner | Cole Charles J | $173,400 |
Source: Public Records
Tax History
| Year | Tax Paid | Tax Assessment Tax Assessment Total Assessment is a certain percentage of the fair market value that is determined by local assessors to be the total taxable value of land and additions on the property. | Land | Improvement |
|---|---|---|---|---|
| 2025 | $7,196 | $653,880 | $282,000 | $371,880 |
| 2024 | $7,196 | $621,170 | $267,000 | $354,170 |
| 2023 | $6,823 | $604,620 | $257,000 | $347,620 |
| 2022 | $6,549 | $572,710 | $227,000 | $345,710 |
| 2021 | $6,001 | $511,360 | $209,000 | $302,360 |
| 2020 | $5,948 | $502,550 | $209,000 | $293,550 |
| 2019 | $5,948 | $502,550 | $209,000 | $293,550 |
| 2018 | $5,472 | $475,860 | $209,000 | $266,860 |
| 2017 | $5,295 | $456,090 | $197,000 | $259,090 |
| 2016 | $5,168 | $446,090 | $187,000 | $259,090 |
| 2015 | $4,838 | $433,540 | $182,000 | $251,540 |
| 2014 | $4,575 | $410,910 | $178,000 | $232,910 |
Source: Public Records
Map
Nearby Homes
- 7669 Long Pine Dr
- 7608 Hamlet St
- 5512 Kathleen Place
- 5506 Joplin St
- 7500 Long Pine Dr
- 5419 Kempsville St
- 7517 Axton St
- 5759 Heming Ave
- 7418 Blackford St
- 7411 Ellwood Place
- 7523 June St
- 7919 Ellet Rd
- 7402 Dunston St
- 5816 Amelia St
- 5807 Accomac St
- 7213 Evanston Rd
- 5414 Queensberry Ave
- 7212 Highland St
- 5633 Inverchapel Rd
- 7740 Carrleigh Pkwy
- 5611 Heming Ave
- 5613 Heming Ave
- 5609 Heming Ave
- 5615 Heming Ave
- 5607 Heming Ave
- 7661 Long Pine Dr
- 5612 Heming Ave
- 7663 Long Pine Dr
- 5614 Heming Ave
- 5610 Heming Ave
- 7659 Long Pine Dr
- 5617 Heming Ave
- 5616 Heming Ave
- 7665 Long Pine Dr
- 5608 Heming Ave
- 5605 Heming Ave
- 7657 Long Pine Dr
- 5618 Heming Ave
- 5603 Viceroy Ct
- 5619 Heming Ave
Your Personal Tour Guide
Ask me questions while you tour the home.