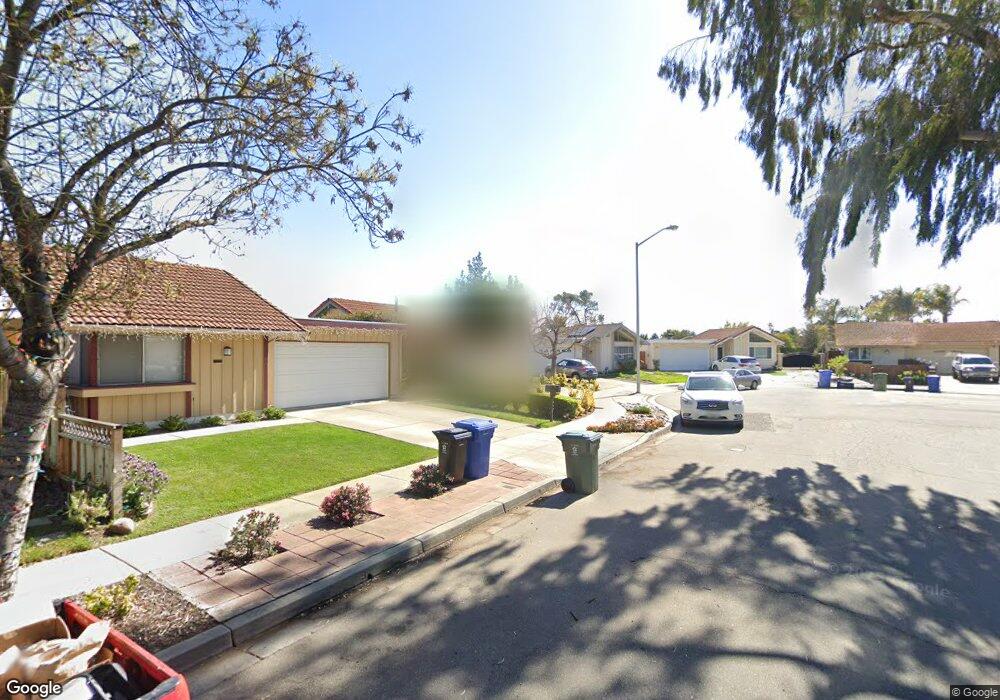
5606 Greenpoint Ct Newark, CA 94560
Estimated Value: $1,239,000 - $1,410,000
4
Beds
2
Baths
1,679
Sq Ft
$797/Sq Ft
Est. Value
About This Home
This home is located at 5606 Greenpoint Ct, Newark, CA 94560 and is currently estimated at $1,337,853, approximately $796 per square foot. 5606 Greenpoint Ct is a home located in Alameda County with nearby schools including Birch Grove Intermediate School, Newark Junior High School, and Newark Memorial High School.
Ownership History
Date
Name
Owned For
Owner Type
Purchase Details
Closed on
Jul 13, 2015
Sold by
Bhatnagar Brijesh P and Bhatnagar Kalpana
Bought by
Pillay Archana and Ram Kevin
Current Estimated Value
Home Financials for this Owner
Home Financials are based on the most recent Mortgage that was taken out on this home.
Original Mortgage
$598,951
Outstanding Balance
$469,138
Interest Rate
3.99%
Mortgage Type
FHA
Estimated Equity
$868,715
Purchase Details
Closed on
May 11, 2004
Sold by
Bhatnagar Brijesh P and Bhatnagar Kalpana
Bought by
Bhatnagar Brijesh P and Bhatnagar Kalpana
Home Financials for this Owner
Home Financials are based on the most recent Mortgage that was taken out on this home.
Original Mortgage
$333,701
Interest Rate
4.62%
Mortgage Type
New Conventional
Purchase Details
Closed on
Feb 20, 2002
Sold by
Bhatnagar Brijesh P and Bhatnagar Kalpana
Bought by
Bhatnagar Brijesh P and Bhatnagar Kalpana
Create a Home Valuation Report for This Property
The Home Valuation Report is an in-depth analysis detailing your home's value as well as a comparison with similar homes in the area
Home Values in the Area
Average Home Value in this Area
Purchase History
| Date | Buyer | Sale Price | Title Company |
|---|---|---|---|
| Pillay Archana | $610,000 | First American Title Company | |
| Bhatnagar Brijesh P | -- | Commonwealth Land Title | |
| Bhatnagar Brijesh P | -- | -- |
Source: Public Records
Mortgage History
| Date | Status | Borrower | Loan Amount |
|---|---|---|---|
| Open | Pillay Archana | $598,951 | |
| Previous Owner | Bhatnagar Brijesh P | $333,701 |
Source: Public Records
Tax History Compared to Growth
Tax History
| Year | Tax Paid | Tax Assessment Tax Assessment Total Assessment is a certain percentage of the fair market value that is determined by local assessors to be the total taxable value of land and additions on the property. | Land | Improvement |
|---|---|---|---|---|
| 2025 | $8,923 | $722,099 | $355,131 | $366,968 |
| 2024 | $8,923 | $707,941 | $348,168 | $359,773 |
| 2023 | $8,683 | $694,064 | $341,343 | $352,721 |
| 2022 | $8,575 | $680,455 | $334,650 | $345,805 |
| 2021 | $8,361 | $667,114 | $328,089 | $339,025 |
| 2020 | $8,255 | $660,276 | $324,726 | $335,550 |
| 2019 | $8,138 | $647,332 | $318,360 | $328,972 |
| 2018 | $8,018 | $634,644 | $312,120 | $322,524 |
| 2017 | $7,815 | $622,200 | $306,000 | $316,200 |
| 2016 | $7,738 | $610,000 | $300,000 | $310,000 |
| 2015 | $3,088 | $215,733 | $81,223 | $134,510 |
| 2014 | $3,001 | $211,507 | $79,632 | $131,875 |
Source: Public Records
Map
Nearby Homes
- 5669 Civic Terrace Ave
- 5859 Central Ave
- 6198 Civic Terrace Ave Unit A
- 5912 Mayhews Landing Rd
- 6176 Thomas Ave
- 37659 Granville Dr
- 36931 Newark Blvd Unit E
- 37088 Arden St
- 5268 Keeler Ct
- 6245 Thornton Ave
- 6189 Thornton Ave Unit C
- 6065 Robertson Ave
- 6257 Honeysuckle Dr
- 6433 Thornton Ave
- 6234 Zulmida Ave
- 37792 Colfax Ct
- 36720 Charles St
- 5169 Lawler Ave
- 36686 Charles St
- 36593 Leone St
- 5594 Greenpoint Ct
- 37265 Greenpoint St
- 5582 Greenpoint Ct
- 37253 Greenpoint St
- 37249 Greenpoint St
- 5692 Saint Matthew Dr
- 5580 Greenpoint Ct
- 37240 Saint Matthew Dr
- 37246 Greenpoint St
- 37237 Greenpoint St
- 5578 Greenpoint Ct
- 37238 Saint Matthew Dr
- 5712 Saint Matthew Dr
- 37236 Greenpoint St
- 37305 Ingraham St
- 37225 Greenpoint St
- 5566 Greenpoint Ct
- 37226 Saint Matthew Dr
- 37306 Fowler St
- 5577 Greenpoint Ct