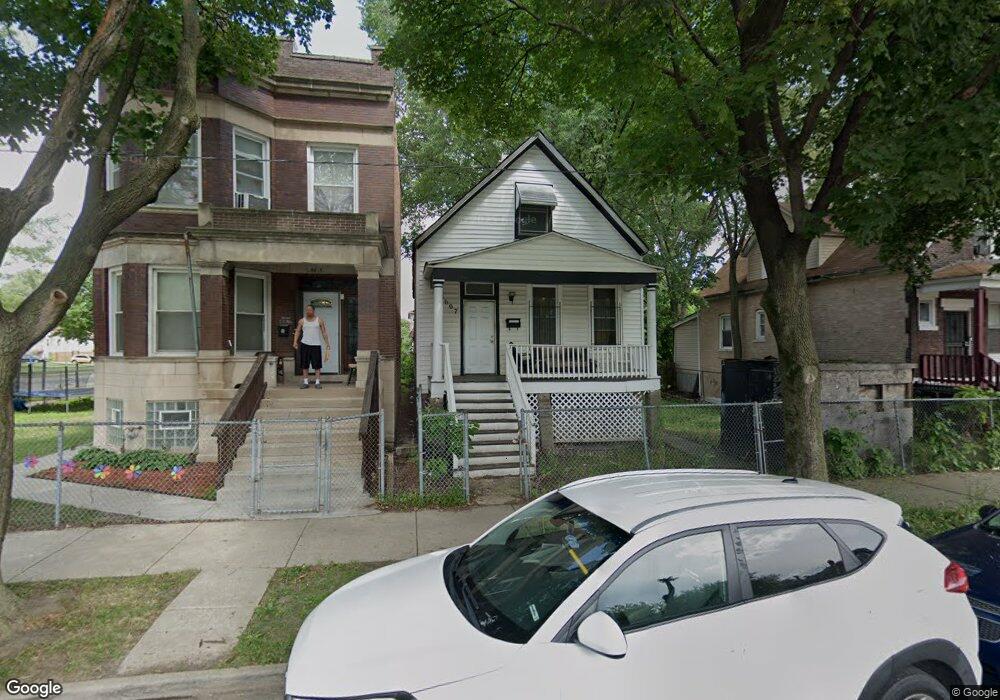
5607 S Laflin St Chicago, IL 60636
Englewood NeighborhoodEstimated Value: $90,196 - $127,000
3
Beds
1
Bath
714
Sq Ft
$151/Sq Ft
Est. Value
About This Home
This home is located at 5607 S Laflin St, Chicago, IL 60636 and is currently estimated at $108,049, approximately $151 per square foot. 5607 S Laflin St is a home located in Cook County with nearby schools including Nicholson Technology Acad Elementary School, CICS Basil, and Academy of St. Benedict the African.
Ownership History
Date
Name
Owned For
Owner Type
Purchase Details
Closed on
Aug 3, 2017
Sold by
County Of Cook
Bought by
Abraham Kristan
Current Estimated Value
Purchase Details
Closed on
Dec 15, 2004
Sold by
River Group Inc
Bought by
Rowland Dominique
Home Financials for this Owner
Home Financials are based on the most recent Mortgage that was taken out on this home.
Original Mortgage
$95,000
Interest Rate
9.7%
Mortgage Type
Unknown
Purchase Details
Closed on
Jun 25, 2004
Sold by
Bank One Na
Bought by
River Group Inc
Purchase Details
Closed on
May 5, 2004
Sold by
Hudspeth Elsie M and Hudspeth Elsie Young
Bought by
Bank One Na
Purchase Details
Closed on
Jan 22, 1997
Sold by
Hudspeth Elisie M
Bought by
Hudspeth Elisie Young
Home Financials for this Owner
Home Financials are based on the most recent Mortgage that was taken out on this home.
Original Mortgage
$29,250
Interest Rate
7.81%
Purchase Details
Closed on
Feb 15, 1996
Sold by
Va
Bought by
Hudspeth Elsie M
Create a Home Valuation Report for This Property
The Home Valuation Report is an in-depth analysis detailing your home's value as well as a comparison with similar homes in the area
Home Values in the Area
Average Home Value in this Area
Purchase History
| Date | Buyer | Sale Price | Title Company |
|---|---|---|---|
| Abraham Kristan | -- | Attorney | |
| Rowland Dominique | $95,000 | Tristar Title Llc | |
| River Group Inc | $51,000 | Premier Title | |
| Bank One Na | -- | -- | |
| Hudspeth Elisie Young | -- | Lawyers Title Insurance Corp | |
| Hudspeth Elsie M | -- | Lawyers Title Insurance Corp |
Source: Public Records
Mortgage History
| Date | Status | Borrower | Loan Amount |
|---|---|---|---|
| Previous Owner | Rowland Dominique | $95,000 | |
| Previous Owner | Hudspeth Elisie Young | $29,250 |
Source: Public Records
Tax History Compared to Growth
Tax History
| Year | Tax Paid | Tax Assessment Tax Assessment Total Assessment is a certain percentage of the fair market value that is determined by local assessors to be the total taxable value of land and additions on the property. | Land | Improvement |
|---|---|---|---|---|
| 2024 | $594 | $3,901 | $938 | $2,963 |
| 2023 | $579 | $2,817 | $2,031 | $786 |
| 2022 | $579 | $2,817 | $2,031 | $786 |
| 2021 | $566 | $2,816 | $2,031 | $785 |
| 2020 | $996 | $4,472 | $2,031 | $2,441 |
| 2019 | $1,010 | $5,025 | $2,031 | $2,994 |
| 2018 | $993 | $5,025 | $2,031 | $2,994 |
| 2017 | $1,453 | $6,752 | $1,875 | $4,877 |
| 2016 | $1,352 | $6,752 | $1,875 | $4,877 |
| 2015 | $1,237 | $6,752 | $1,875 | $4,877 |
| 2014 | $1,130 | $6,091 | $1,718 | $4,373 |
| 2013 | $1,108 | $6,091 | $1,718 | $4,373 |
Source: Public Records
Map
Nearby Homes
- 5617 S Laflin St
- 5605 S Justine St
- 5528 S Loomis Blvd
- 5633 S Justine St
- 1510 W Garfield Blvd
- 5642 S Loomis Blvd
- 5538 S Ashland Ave
- 5711 S Laflin St
- 5748 S Laflin St
- 5749 S Bishop St
- 5656 S Marshfield Ave
- 5525 S Throop St
- 5734 S Ashland Ave
- 5631 S Throop St
- 5335 S Bishop St
- 5624 S Elizabeth St
- 5742 S Marshfield Ave
- 1225 W Garfield Blvd
- 5720 S Paulina St
- 5658 S Hermitage Ave
- 5603 S Laflin St
- 5611 S Laflin St
- 5613 S Laflin St
- 5617 S Laflin St
- 5619 S Laflin St
- 5604 S Bishop St
- 5604 S Bishop St
- 5602 S Bishop St
- 5545 S Laflin St Unit 1
- 5600 S Bishop St
- 5608 S Bishop St
- 5621 S Laflin St Unit 2
- 5621 S Laflin St
- 5604 S Laflin St Unit 2
- 5610 S Bishop St
- 5623 S Laflin St
- 5618 S Bishop St
- 5608 S Laflin St
- 5608 S Laflin St
- 5627 S Laflin St