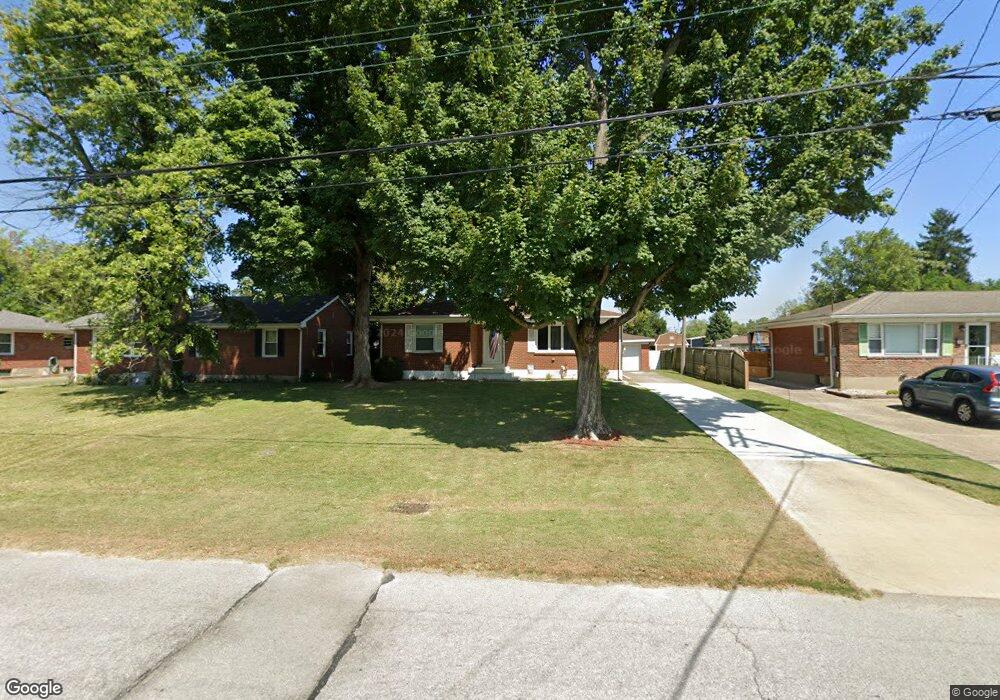
5609 Azalea Ln Louisville, KY 40258
Pleasure Ridge Park NeighborhoodEstimated Value: $205,726 - $243,000
--
Bed
1
Bath
1,065
Sq Ft
$207/Sq Ft
Est. Value
About This Home
This home is located at 5609 Azalea Ln, Louisville, KY 40258 and is currently estimated at $220,932, approximately $207 per square foot. 5609 Azalea Ln is a home located in Jefferson County with nearby schools including Shacklette Elementary School, Wilkerson Elementary School, and Greenwood Elementary School.
Ownership History
Date
Name
Owned For
Owner Type
Purchase Details
Closed on
Dec 29, 2023
Sold by
Cowles Kimberly A
Bought by
Hutchins Tracy L
Current Estimated Value
Home Financials for this Owner
Home Financials are based on the most recent Mortgage that was taken out on this home.
Original Mortgage
$174,843
Outstanding Balance
$171,975
Interest Rate
7.29%
Mortgage Type
New Conventional
Estimated Equity
$48,957
Purchase Details
Closed on
Dec 27, 2019
Sold by
Jackson Kimberly L
Bought by
Cowles Kimberly A and Cowles John A
Purchase Details
Closed on
Apr 26, 2019
Sold by
Hidden Forest Development Llc
Bought by
Premier Homes Of Southern Indiana Inc
Purchase Details
Closed on
Apr 23, 2013
Sold by
Jackson Kimberly L and Coffey Kimberly
Bought by
Jackson Kimberly L
Home Financials for this Owner
Home Financials are based on the most recent Mortgage that was taken out on this home.
Original Mortgage
$76,700
Interest Rate
3.59%
Mortgage Type
New Conventional
Create a Home Valuation Report for This Property
The Home Valuation Report is an in-depth analysis detailing your home's value as well as a comparison with similar homes in the area
Home Values in the Area
Average Home Value in this Area
Purchase History
| Date | Buyer | Sale Price | Title Company |
|---|---|---|---|
| Hutchins Tracy L | $180,250 | None Listed On Document | |
| Hutchins Tracy L | $180,250 | None Listed On Document | |
| Cowles Kimberly A | $85,000 | Agency Title Inc | |
| Premier Homes Of Southern Indiana Inc | -- | Momentum Title Agency Llc | |
| Jackson Kimberly L | $110,000 | None Available |
Source: Public Records
Mortgage History
| Date | Status | Borrower | Loan Amount |
|---|---|---|---|
| Open | Hutchins Tracy L | $174,843 | |
| Closed | Hutchins Tracy L | $174,843 | |
| Previous Owner | Jackson Kimberly L | $76,700 |
Source: Public Records
Tax History Compared to Growth
Tax History
| Year | Tax Paid | Tax Assessment Tax Assessment Total Assessment is a certain percentage of the fair market value that is determined by local assessors to be the total taxable value of land and additions on the property. | Land | Improvement |
|---|---|---|---|---|
| 2024 | $1,820 | $156,190 | $22,500 | $133,690 |
| 2023 | $1,871 | $156,190 | $22,500 | $133,690 |
| 2022 | $1,441 | $119,850 | $20,000 | $99,850 |
| 2021 | $1,552 | $119,850 | $20,000 | $99,850 |
| 2020 | $1,387 | $119,850 | $20,000 | $99,850 |
| 2019 | $1,359 | $119,850 | $20,000 | $99,850 |
| 2018 | $1,110 | $99,040 | $27,000 | $72,040 |
| 2017 | $1,039 | $99,040 | $27,000 | $72,040 |
| 2013 | $990 | $99,040 | $27,000 | $72,040 |
Source: Public Records
Map
Nearby Homes
- 5500 Azalea Ln
- 7716 Jonquil Dr
- 7801 Mango Dr
- 6100 Azalea Ln
- 5901 Jessamine Ln
- 7711 Bramble Ln
- 7906 Daffodil Dr
- 5929 Dewitt Dr Unit 1001
- 7903 Columbine Dr
- 5214 Plume Dr
- 5006 Tumeric Ln
- 6102 Black Tie Ct
- 6102 Goalby Dr
- 6116 Goalby Dr
- 7107 Gageland Rd
- 5406 Trefoil Ln
- 6123 Casper Dr
- 7228 Daisy Ave
- 8004 Canna Dr
- 5901 Soverign Ct
- 5701 Azalea Ln
- 5607 Azalea Ln
- 5703 Azalea Ln
- 5605 Azalea Ln
- 5608 Greenwood Rd
- 5610 Greenwood Rd
- 5705 Azalea Ln
- 5603 Azalea Ln
- 5606 Greenwood Rd
- 5602 Azalea Ln
- 5700 Greenwood Rd
- 7602 Daffodil Dr
- 5604 Greenwood Rd
- 5707 Azalea Ln
- 5704 Greenwood Rd
- 7604 Daffodil Dr
- 7703 Carnation Dr
- 7702 Carnation Dr
- 5600 Azalea Ln
- 5602 Greenwood Rd