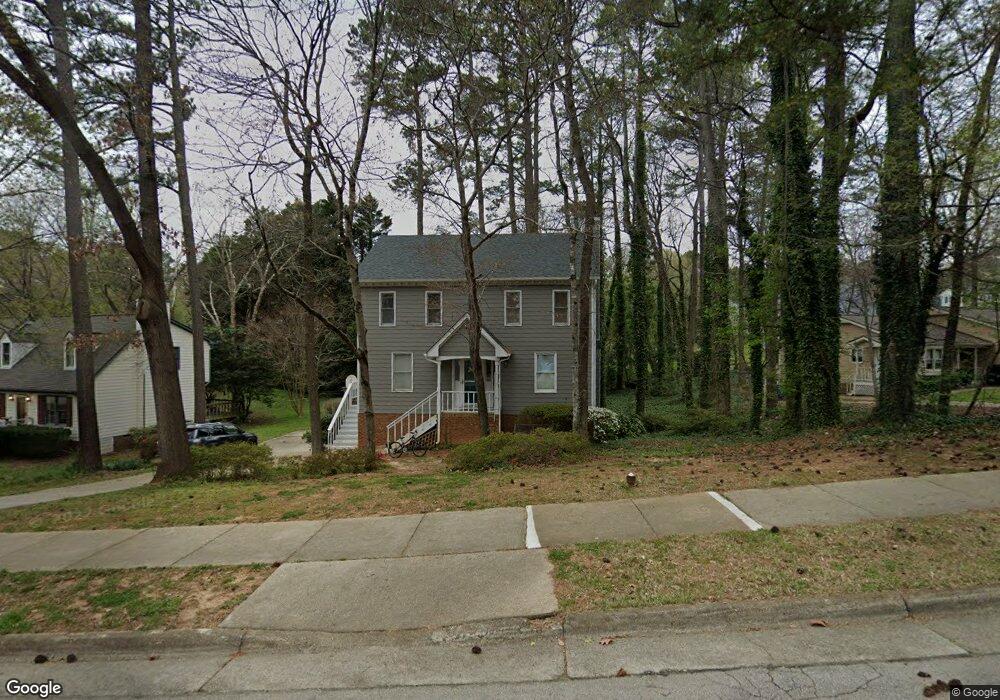
5609 Oldtowne Rd Raleigh, NC 27612
North Hills NeighborhoodEstimated Value: $486,000 - $544,000
Studio
3
Baths
1,788
Sq Ft
$285/Sq Ft
Est. Value
About This Home
This home is located at 5609 Oldtowne Rd, Raleigh, NC 27612 and is currently estimated at $509,550, approximately $284 per square foot. 5609 Oldtowne Rd is a home located in Wake County with nearby schools including Lynn Road Elementary School, Carroll Middle, and Sanderson High School.
Ownership History
Date
Name
Owned For
Owner Type
Purchase Details
Closed on
May 12, 2010
Sold by
West Andrea Mooney and West Ashley
Bought by
West Andrea Mooney and West Ashley
Current Estimated Value
Home Financials for this Owner
Home Financials are based on the most recent Mortgage that was taken out on this home.
Original Mortgage
$184,676
Outstanding Balance
$116,872
Interest Rate
4.25%
Mortgage Type
FHA
Estimated Equity
$392,679
Purchase Details
Closed on
Sep 10, 2002
Sold by
Cendant Mobility Financial Corp
Bought by
West Ashley and Mooney Andrea M
Home Financials for this Owner
Home Financials are based on the most recent Mortgage that was taken out on this home.
Original Mortgage
$163,927
Interest Rate
6.19%
Mortgage Type
FHA
Purchase Details
Closed on
May 15, 2002
Sold by
Barrett David and Barrett Silke
Bought by
Cendant Mobility Financial Corp
Create a Home Valuation Report for This Property
The Home Valuation Report is an in-depth analysis detailing your home's value as well as a comparison with similar homes in the area
Home Values in the Area
Average Home Value in this Area
Purchase History
| Date | Buyer | Sale Price | Title Company |
|---|---|---|---|
| West Andrea Mooney | -- | None Available | |
| West Ashley | $166,500 | -- | |
| Cendant Mobility Financial Corp | $166,500 | -- |
Source: Public Records
Mortgage History
| Date | Status | Borrower | Loan Amount |
|---|---|---|---|
| Open | West Andrea Mooney | $184,676 | |
| Closed | West Ashley | $163,927 |
Source: Public Records
Tax History
| Year | Tax Paid | Tax Assessment Tax Assessment Total Assessment is a certain percentage of the fair market value that is determined by local assessors to be the total taxable value of land and additions on the property. | Land | Improvement |
|---|---|---|---|---|
| 2025 | $4,291 | $489,722 | $200,000 | $289,722 |
| 2024 | $4,273 | $489,722 | $200,000 | $289,722 |
Source: Public Records
Map
Nearby Homes
- 5725 Pool Side Dr
- 5749 Three Oaks Dr
- 5609 Groomsbridge Ct
- 5444 Pine Top Cir
- 5410 Ridgeloch Place
- 5529 Shadowbrook Dr
- 5400 Belsay Dr
- 1541 Shadowood Ln
- 6004 Tarnhour Ct
- 5909 Lead Mine Rd
- 5605 N Hills Dr
- 1910 W Millbrook Rd
- 1330 Garden Crest Cir
- 1713 Frenchwood Dr
- 1900 Wimbish Ln
- 4846 Ludwell Branch Ct
- 1375 Garden Crest Cir
- 1306 Lennox Place
- 1104 Temple St
- 2237 Misskelly Dr
- 5609 Old Towne Rd
- 5605 Old Towne Rd
- 5605 Oldtowne Rd
- 5613 Oldtowne Rd
- 5613 Old Towne Rd
- 2005 Biddestone Ct
- 5600 Groomsbridge Ct
- 2001 Biddestone Ct
- 5725 Poolside Dr
- 5723 Poolside Dr
- 5608 Groomsbridge Ct
- 5721 Pool Side Dr
- 5721 Pool Side Dr Unit Drive
- 5721 Poolside Dr
- 5721 Poolside Cir
- 5741 Poolside Dr
- 5719 Poolside Dr
- 5717 Poolside Dr
- 5727 Poolside Dr
- 5757 Three Oaks Dr
Your Personal Tour Guide
Ask me questions while you tour the home.