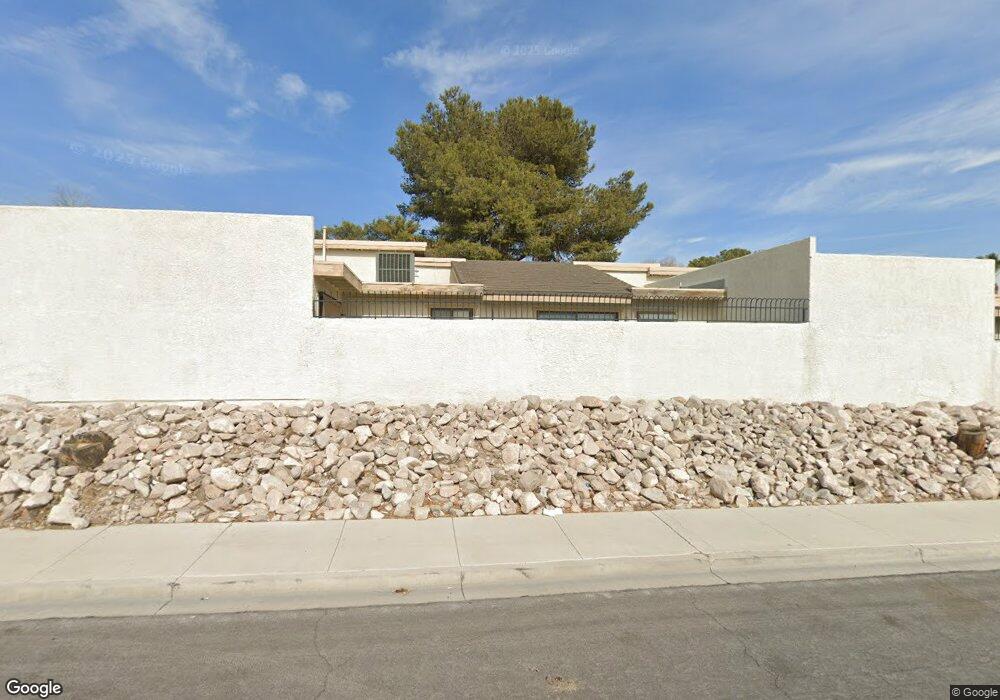
5609 Roseridge Ave Unit 2 Las Vegas, NV 89107
Michael Way NeighborhoodEstimated Value: $297,000 - $323,000
3
Beds
2
Baths
1,456
Sq Ft
$212/Sq Ft
Est. Value
About This Home
This home is located at 5609 Roseridge Ave Unit 2, Las Vegas, NV 89107 and is currently estimated at $308,550, approximately $211 per square foot. 5609 Roseridge Ave Unit 2 is a home located in Clark County with nearby schools including J.T. McWlliams Elementary School, Robert O Gibson Middle School, and Western High School.
Ownership History
Date
Name
Owned For
Owner Type
Purchase Details
Closed on
May 30, 2017
Sold by
Sams Frank J and Sams Jessie K
Bought by
Horikawa Joel
Current Estimated Value
Home Financials for this Owner
Home Financials are based on the most recent Mortgage that was taken out on this home.
Original Mortgage
$144,827
Outstanding Balance
$122,392
Interest Rate
4.62%
Mortgage Type
FHA
Estimated Equity
$186,158
Purchase Details
Closed on
Dec 27, 2012
Sold by
Wircy James
Bought by
Collins Chelsea S
Home Financials for this Owner
Home Financials are based on the most recent Mortgage that was taken out on this home.
Original Mortgage
$85,232
Interest Rate
3.87%
Mortgage Type
FHA
Purchase Details
Closed on
Jul 24, 2002
Sold by
Moore Walter Craig
Bought by
Sams Frank J and Sams Jessie K
Home Financials for this Owner
Home Financials are based on the most recent Mortgage that was taken out on this home.
Original Mortgage
$103,537
Interest Rate
6.6%
Mortgage Type
FHA
Create a Home Valuation Report for This Property
The Home Valuation Report is an in-depth analysis detailing your home's value as well as a comparison with similar homes in the area
Home Values in the Area
Average Home Value in this Area
Purchase History
| Date | Buyer | Sale Price | Title Company |
|---|---|---|---|
| Horikawa Joel | $147,500 | Ticor Title Las Vegas | |
| Collins Chelsea S | -- | Fidelity National Title Las | |
| Sams Frank J | -- | Fidelity Natioanl Title Las | |
| Sams Frank J | $105,000 | Pioneer National Title | |
| Moore Walter Craig | -- | Pioneer National Title |
Source: Public Records
Mortgage History
| Date | Status | Borrower | Loan Amount |
|---|---|---|---|
| Open | Horikawa Joel | $144,827 | |
| Previous Owner | Sams Frank J | $85,232 | |
| Previous Owner | Sams Frank J | $103,537 |
Source: Public Records
Tax History Compared to Growth
Tax History
| Year | Tax Paid | Tax Assessment Tax Assessment Total Assessment is a certain percentage of the fair market value that is determined by local assessors to be the total taxable value of land and additions on the property. | Land | Improvement |
|---|---|---|---|---|
| 2025 | $1,212 | $57,780 | $23,800 | $33,980 |
| 2024 | $1,123 | $57,780 | $23,800 | $33,980 |
| 2023 | $748 | $53,872 | $22,050 | $31,822 |
| 2022 | $1,040 | $49,544 | $18,900 | $30,644 |
| 2021 | $963 | $41,626 | $16,450 | $25,176 |
| 2020 | $892 | $42,741 | $16,100 | $26,641 |
| 2019 | $836 | $40,056 | $13,300 | $26,756 |
| 2018 | $797 | $37,429 | $11,550 | $25,879 |
| 2017 | $1,202 | $36,013 | $10,500 | $25,513 |
| 2016 | $748 | $33,837 | $7,350 | $26,487 |
| 2015 | $745 | $24,682 | $5,250 | $19,432 |
| 2014 | $722 | $20,678 | $4,725 | $15,953 |
Source: Public Records
Map
Nearby Homes
- 5620 Roseridge Ave
- 600 Woodmount Dr
- 5713 Whiteridge Ave
- 5705 Pearldrop Ave
- 5612 Pearldrop Ave
- 5420 Moonstruck Ave
- 5709 Goldmount Ave
- 304 Orland St Unit 53
- 304 Orland St Unit 56
- 304 Orland St Unit 39
- 304 Orland St Unit 38
- 304 Orland St Unit 47
- 304 Orland St Unit 43
- 212 Orland St Unit 23
- 212 Orland St Unit 28
- 212 Orland St Unit 22
- 212 Orland St Unit 19
- 212 Orland St Unit 17
- 5720 Goldmount Ave
- 208 Orland St Unit 10
- 5613 Roseridge Ave
- 5605 Roseridge Ave
- 5617 Roseridge Ave
- 501 Westridge Dr
- 500 Woodmount Dr
- 5616 Roseridge Ave
- 240 Kipling St
- 505 Westridge Dr
- 504 Woodmount Dr Unit 2
- 5601 Bromley Ave
- 5701 Roseridge Ave
- 5609 Whiteridge Ave
- 509 Westridge Dr
- 401 Light Beam St
- 508 Woodmount Dr
- 405 Light Beam St
- 5700 Roseridge Ave
- 237 Kipling St
- 5445 Moonstruck Ave
- 5613 Whiteridge Ave