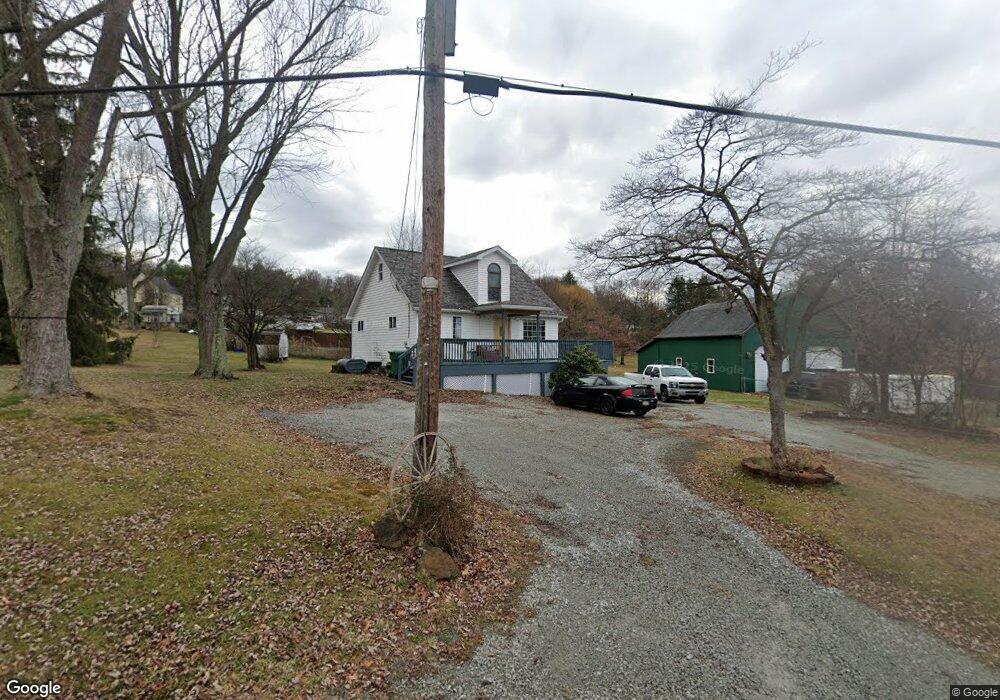
561 Alexander Rd Latrobe, PA 15650
Estimated Value: $154,000 - $196,000
--
Bed
2
Baths
676
Sq Ft
$264/Sq Ft
Est. Value
About This Home
This home is located at 561 Alexander Rd, Latrobe, PA 15650 and is currently estimated at $178,762, approximately $264 per square foot. 561 Alexander Rd is a home located in Westmoreland County with nearby schools including Greater Latrobe Junior High School, Greater Latrobe Senior High School, and Christ the Divine Teacher School.
Ownership History
Date
Name
Owned For
Owner Type
Purchase Details
Closed on
May 10, 2024
Sold by
Rhome Danielle N and Sigafoes Danielle N
Bought by
Brown Seth M
Current Estimated Value
Home Financials for this Owner
Home Financials are based on the most recent Mortgage that was taken out on this home.
Original Mortgage
$166,250
Outstanding Balance
$164,015
Interest Rate
7.1%
Mortgage Type
New Conventional
Estimated Equity
$14,747
Purchase Details
Closed on
Nov 30, 2016
Sold by
Muchnock Stacie Anna and Sever Stacie A
Bought by
Rhome Danielle N
Home Financials for this Owner
Home Financials are based on the most recent Mortgage that was taken out on this home.
Original Mortgage
$66,300
Interest Rate
3.52%
Mortgage Type
New Conventional
Purchase Details
Closed on
Oct 17, 2002
Sold by
Muchnock Michael
Bought by
Muchnock Stacie Anna
Create a Home Valuation Report for This Property
The Home Valuation Report is an in-depth analysis detailing your home's value as well as a comparison with similar homes in the area
Home Values in the Area
Average Home Value in this Area
Purchase History
| Date | Buyer | Sale Price | Title Company |
|---|---|---|---|
| Brown Seth M | $175,000 | None Listed On Document | |
| Rhome Danielle N | $78,000 | None Available | |
| Muchnock Stacie Anna | -- | -- |
Source: Public Records
Mortgage History
| Date | Status | Borrower | Loan Amount |
|---|---|---|---|
| Open | Brown Seth M | $166,250 | |
| Previous Owner | Rhome Danielle N | $66,300 |
Source: Public Records
Tax History Compared to Growth
Tax History
| Year | Tax Paid | Tax Assessment Tax Assessment Total Assessment is a certain percentage of the fair market value that is determined by local assessors to be the total taxable value of land and additions on the property. | Land | Improvement |
|---|---|---|---|---|
| 2025 | $1,600 | $13,260 | $2,600 | $10,660 |
| 2024 | $1,600 | $13,260 | $2,600 | $10,660 |
| 2023 | $1,468 | $13,260 | $2,600 | $10,660 |
| 2022 | $1,468 | $13,260 | $2,600 | $10,660 |
| 2021 | $1,454 | $13,260 | $2,600 | $10,660 |
| 2020 | $1,431 | $13,260 | $2,600 | $10,660 |
| 2019 | $1,411 | $13,260 | $2,600 | $10,660 |
| 2018 | $1,405 | $13,260 | $2,600 | $10,660 |
| 2017 | $1,368 | $13,260 | $2,600 | $10,660 |
| 2016 | $321 | $13,260 | $2,600 | $10,660 |
| 2015 | -- | $13,260 | $2,600 | $10,660 |
| 2014 | -- | $13,260 | $2,600 | $10,660 |
Source: Public Records
Map
Nearby Homes
- 659 Alexander Rd
- 1406 Rolling Acres Rd
- 311 Twin Lakes Rd
- 275 Twin Lakes Rd
- 1117 Sullenberger Rd
- 1153 Lauralynn Dr
- 470 Donohoe Rd
- 1420 Highview Dr
- 5010 Linwood Ct
- 3021 White Pines Dr
- 577 Bovard Luxor Rd
- 400 Primrose Dr
- 227 Meadow Spring Rd
- 361 E High Acres Rd
- 434 Eton Dr
- 359 Meadow Spring Rd
- 98 Quail Run
- 74 Quail Run
- 3019 Ben Venue Dr
- 3041 Mcclellan Dr
- 561 Alexander Rd
- 561 Alexander Rd
- 567 Alexander Rd
- 555 Alexander Rd
- 571 Alexander Rd
- 539 Alexander Rd
- 539 Alexander Rd
- 105 Wil Lo Be Ln
- 582 Alexander Rd
- 118 Claremont Ln
- 523 Alexander Rd
- 123 Power Dr
- 135 Claremont Ln
- 123 Rolling Acres Dr
- 109 Rock Pointe Ln
- 511 Alexander Rd
- 139 Claremont Ln
- 717 Donohoe Rd
- 725 Donohoe Rd
- 111 Rock Pointe Ln