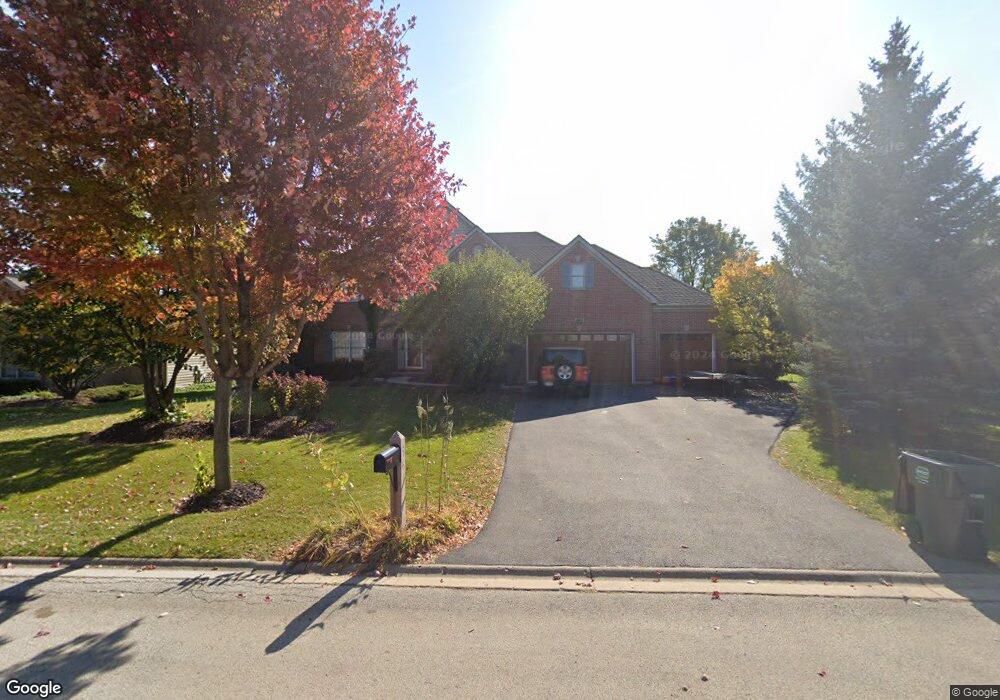
561 Clover Dr Algonquin, IL 60102
Far West Algonquin NeighborhoodEstimated Value: $604,369 - $680,000
Studio
--
Bath
3,155
Sq Ft
$208/Sq Ft
Est. Value
About This Home
This home is located at 561 Clover Dr, Algonquin, IL 60102 and is currently estimated at $655,592, approximately $207 per square foot. 561 Clover Dr is a home located in McHenry County with nearby schools including Mackeben Elementary School, Conley Elementary School, and Heineman Middle School.
Ownership History
Date
Name
Owned For
Owner Type
Purchase Details
Closed on
Jul 30, 2024
Sold by
Palka Joseph J and Palka Kimberly A
Bought by
Palka Joseph J
Current Estimated Value
Home Financials for this Owner
Home Financials are based on the most recent Mortgage that was taken out on this home.
Original Mortgage
$390,000
Outstanding Balance
$385,492
Interest Rate
7.88%
Mortgage Type
New Conventional
Estimated Equity
$270,100
Purchase Details
Closed on
Nov 28, 2006
Sold by
Lasalle Bank Na
Bought by
Palka Kimberly A and Palka Joseph J
Purchase Details
Closed on
Sep 22, 2003
Sold by
Algonquin State Bank
Bought by
Lasalle Bank
Home Financials for this Owner
Home Financials are based on the most recent Mortgage that was taken out on this home.
Original Mortgage
$224,050
Interest Rate
6.4%
Mortgage Type
Purchase Money Mortgage
Create a Home Valuation Report for This Property
The Home Valuation Report is an in-depth analysis detailing your home's value as well as a comparison with similar homes in the area
Home Values in the Area
Average Home Value in this Area
Purchase History
| Date | Buyer | Sale Price | Title Company |
|---|---|---|---|
| Palka Joseph J | -- | First American Title | |
| Palka Kimberly A | -- | None Available | |
| Lasalle Bank | $440,917 | Northern Land Title Corp |
Source: Public Records
Mortgage History
| Date | Status | Borrower | Loan Amount |
|---|---|---|---|
| Open | Palka Joseph J | $390,000 | |
| Previous Owner | Lasalle Bank | $224,050 |
Source: Public Records
Tax History
| Year | Tax Paid | Tax Assessment Tax Assessment Total Assessment is a certain percentage of the fair market value that is determined by local assessors to be the total taxable value of land and additions on the property. | Land | Improvement |
|---|---|---|---|---|
| 2024 | $13,494 | $191,406 | $17,702 | $173,704 |
| 2023 | $13,124 | $171,942 | $15,902 | $156,040 |
| 2022 | $12,451 | $156,567 | $14,480 | $142,087 |
| 2021 | $12,043 | $147,454 | $13,637 | $133,817 |
| 2020 | $11,869 | $143,521 | $13,273 | $130,248 |
| 2019 | $11,562 | $139,857 | $12,934 | $126,923 |
| 2018 | $12,477 | $147,084 | $14,556 | $132,528 |
| 2017 | $12,349 | $138,615 | $13,718 | $124,897 |
| 2016 | $12,471 | $131,788 | $13,042 | $118,746 |
| 2013 | -- | $121,623 | $19,785 | $101,838 |
Source: Public Records
Map
Nearby Homes
- 3650 Wintergreen Terrace
- 940 Treeline Dr
- 3610 Lakeview Dr
- 4241 Wanderlust Dr
- 212 Rhinebeck Way
- 531 Alpine Dr
- 6 Camberwell Ct
- 430 Tuscany Dr
- 9105 Algonquin Rd
- 1171 Kingsmill Dr
- 16 Springbrook Ln
- 3260 Nottingham Dr
- 2660 Harnish Dr
- 6 Sugar Maple Ct
- 601 Woods Creek Ln
- 4 Greenbrier Ct
- 2601 Harnish Dr
- 895 Eineke Blvd
- 11290 Wildridge Ln
- 11320 Wildridge Ln
- 571 Clover Dr
- 551 Clover Dr
- 610 Goldenrod Dr
- 610 Bluestem Ln
- 581 Clover Dr
- 540 Clover Dr
- 550 Clover Dr
- 620 Goldenrod Dr
- 560 Clover Dr
- 530 Clover Dr
- 591 Clover Dr
- 611 Goldenrod Dr
- 621 Goldenrod Dr
- 570 Clover Dr
- 520 Clover Dr
- 601 Clover Dr
- 3791 Bunker Hill Dr
- 611 Bluestem Ln
- 3781 Bunker Hill Dr
- 641 Goldenrod Dr
Your Personal Tour Guide
Ask me questions while you tour the home.