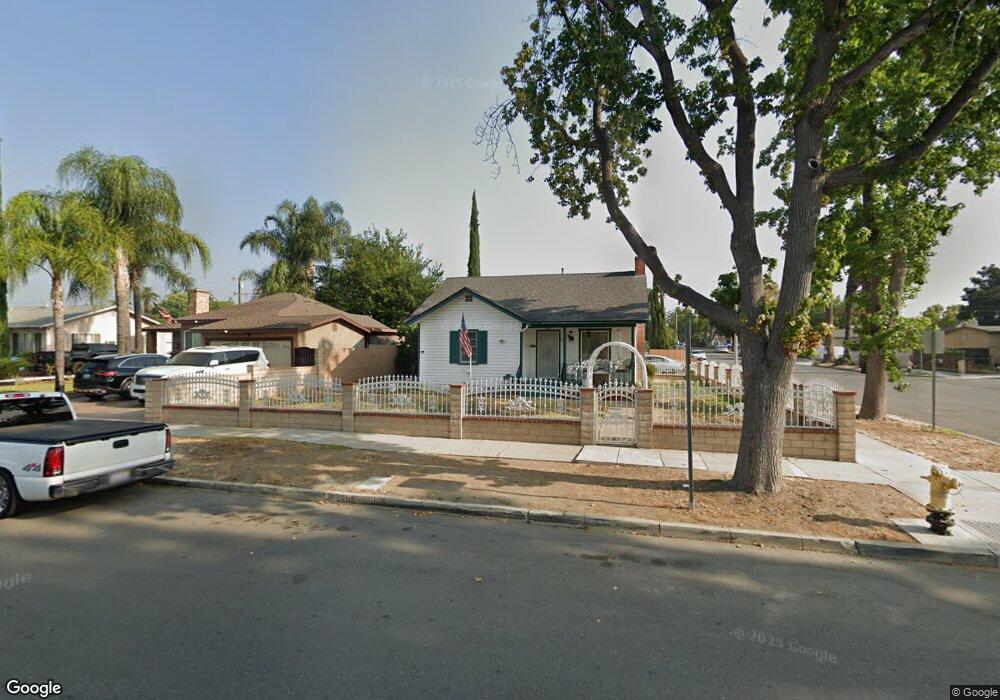
561 E F St Ontario, CA 91764
Downtown Ontario NeighborhoodEstimated Value: $557,000 - $697,000
2
Beds
1
Bath
991
Sq Ft
$620/Sq Ft
Est. Value
About This Home
This home is located at 561 E F St, Ontario, CA 91764 and is currently estimated at $614,834, approximately $620 per square foot. 561 E F St is a home located in San Bernardino County with nearby schools including Central Language Academy, Vina Danks Middle, and Chaffey High School.
Ownership History
Date
Name
Owned For
Owner Type
Purchase Details
Closed on
Nov 8, 2002
Sold by
Hernandez David
Bought by
Flores Ventura and Vicario Edna
Current Estimated Value
Purchase Details
Closed on
May 5, 1995
Sold by
Hernandez Mary
Bought by
Hernandez David
Home Financials for this Owner
Home Financials are based on the most recent Mortgage that was taken out on this home.
Original Mortgage
$68,000
Interest Rate
8.43%
Purchase Details
Closed on
Apr 17, 1995
Sold by
Baldwin Lydia L
Bought by
Flores Ventura and Vicario Edna
Home Financials for this Owner
Home Financials are based on the most recent Mortgage that was taken out on this home.
Original Mortgage
$68,000
Interest Rate
8.43%
Create a Home Valuation Report for This Property
The Home Valuation Report is an in-depth analysis detailing your home's value as well as a comparison with similar homes in the area
Home Values in the Area
Average Home Value in this Area
Purchase History
| Date | Buyer | Sale Price | Title Company |
|---|---|---|---|
| Flores Ventura | -- | -- | |
| Hernandez David | -- | Investors Title Company | |
| Flores Ventura | $85,000 | Investors Title Company |
Source: Public Records
Mortgage History
| Date | Status | Borrower | Loan Amount |
|---|---|---|---|
| Previous Owner | Flores Ventura | $68,000 | |
| Closed | Flores Ventura | $14,850 |
Source: Public Records
Tax History
| Year | Tax Paid | Tax Assessment Tax Assessment Total Assessment is a certain percentage of the fair market value that is determined by local assessors to be the total taxable value of land and additions on the property. | Land | Improvement |
|---|---|---|---|---|
| 2025 | $1,992 | $179,818 | $96,711 | $83,107 |
| 2024 | $1,947 | $176,292 | $94,815 | $81,477 |
| 2023 | $1,892 | $172,835 | $92,956 | $79,879 |
| 2022 | $1,867 | $169,446 | $91,133 | $78,313 |
| 2021 | $1,856 | $166,123 | $89,346 | $76,777 |
| 2020 | $1,823 | $164,420 | $88,430 | $75,990 |
| 2019 | $1,808 | $161,196 | $86,696 | $74,500 |
| 2018 | $1,783 | $158,035 | $84,996 | $73,039 |
| 2017 | $1,719 | $154,936 | $83,329 | $71,607 |
| 2016 | $1,651 | $151,898 | $81,695 | $70,203 |
| 2015 | $1,640 | $149,616 | $80,468 | $69,148 |
| 2014 | $1,589 | $146,685 | $78,892 | $67,793 |
Source: Public Records
Map
Nearby Homes
- 712 E H St
- 230 N Monterey Ave
- 326 E I St
- 535 N Allyn Ave
- 127 N Campus Ave
- 811 E Nocta St
- 958 E Flora St
- 736 E Holt Blvd
- 744 E Holt Blvd
- 730 N Holmes Ave
- 1039 E Elma St
- 405 E Harvard Place
- 830 E Emporia St
- 1038 E J St
- 517 W I St
- 522 N Parkside Dr
- 931 E Princeton St
- 821 N Alameda Ave
- 516 E Sunkist St
- 412 S Palm Ave
Your Personal Tour Guide
Ask me questions while you tour the home.