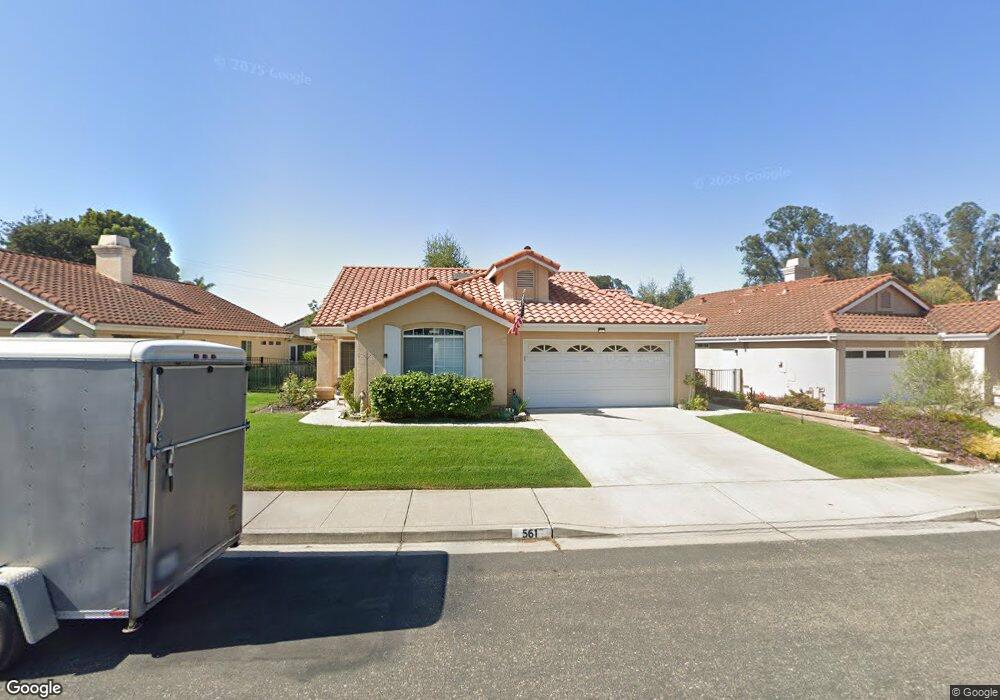
561 Riviera Cir Nipomo, CA 93444
Blacklake NeighborhoodEstimated Value: $682,489 - $766,000
2
Beds
2
Baths
1,388
Sq Ft
$526/Sq Ft
Est. Value
About This Home
This home is located at 561 Riviera Cir, Nipomo, CA 93444 and is currently estimated at $729,622, approximately $525 per square foot. 561 Riviera Cir is a home located in San Luis Obispo County with nearby schools including Dorothea Lange Elementary School, Mesa Middle School, and Nipomo High School.
Ownership History
Date
Name
Owned For
Owner Type
Purchase Details
Closed on
Feb 20, 2002
Sold by
Millis Deanna May
Bought by
Millis Deanna May
Current Estimated Value
Home Financials for this Owner
Home Financials are based on the most recent Mortgage that was taken out on this home.
Original Mortgage
$210,000
Outstanding Balance
$84,349
Interest Rate
6.8%
Estimated Equity
$645,273
Purchase Details
Closed on
Mar 5, 1994
Sold by
Imperial Management Inc
Bought by
Millis Deanna May
Home Financials for this Owner
Home Financials are based on the most recent Mortgage that was taken out on this home.
Original Mortgage
$152,500
Interest Rate
7%
Purchase Details
Closed on
Mar 3, 1994
Sold by
Millis Mark M
Bought by
Millis Deanna May
Home Financials for this Owner
Home Financials are based on the most recent Mortgage that was taken out on this home.
Original Mortgage
$152,500
Interest Rate
7%
Create a Home Valuation Report for This Property
The Home Valuation Report is an in-depth analysis detailing your home's value as well as a comparison with similar homes in the area
Home Values in the Area
Average Home Value in this Area
Purchase History
| Date | Buyer | Sale Price | Title Company |
|---|---|---|---|
| Millis Deanna May | -- | Fidelity National Title Co | |
| Millis Deanna May | $169,500 | First American Title | |
| Millis Deanna May | -- | First American Title |
Source: Public Records
Mortgage History
| Date | Status | Borrower | Loan Amount |
|---|---|---|---|
| Open | Millis Deanna May | $210,000 | |
| Closed | Millis Deanna May | $152,500 |
Source: Public Records
Tax History
| Year | Tax Paid | Tax Assessment Tax Assessment Total Assessment is a certain percentage of the fair market value that is determined by local assessors to be the total taxable value of land and additions on the property. | Land | Improvement |
|---|---|---|---|---|
| 2025 | $4,151 | $288,055 | $127,456 | $160,599 |
| 2024 | $4,125 | $282,407 | $124,957 | $157,450 |
| 2023 | $4,125 | $276,870 | $122,507 | $154,363 |
| 2022 | $4,091 | $271,442 | $120,105 | $151,337 |
| 2021 | $2,931 | $266,120 | $117,750 | $148,370 |
| 2020 | $2,899 | $263,392 | $116,543 | $146,849 |
| 2019 | $2,881 | $258,228 | $114,258 | $143,970 |
| 2018 | $2,847 | $253,166 | $112,018 | $141,148 |
| 2017 | $2,789 | $248,203 | $109,822 | $138,381 |
| 2016 | $2,633 | $243,337 | $107,669 | $135,668 |
| 2015 | $2,596 | $239,683 | $106,052 | $133,631 |
| 2014 | $2,501 | $234,989 | $103,975 | $131,014 |
Source: Public Records
Map
Nearby Homes
- 639 Barberry Way
- 808 Albert Way
- 708 Albert Way
- 1790 Calle Laguna
- 1160 Oakmont Place Unit 1
- 462 Camino Perillo
- 931 Jacqueline Place
- 1950 Lemon Ranch Rd
- 1060 Dawn Rd
- 1658 Waterview Place
- 1772 Waterview Place
- 957 Jacqueline Place
- 1835 Northwood Rd
- 2085 Westhampton Dr
- 1024 Maggie Ln
- 2095 Idyllwild Place
- 1276 Pomeroy Rd
- 1071 Ford Dr
- 879 Wigeon Way Unit 2
- 625 Thunder Gulch
- 557 Riviera Cir
- 565 Riviera Cir
- 576 Masters Cir
- 580 Masters Cir
- 571 Riviera Cir
- 553 Riviera Cir
- 564 Riviera Cir
- 560 Riviera Cir
- 572 Masters Cir
- 584 Masters Cir
- 568 Riviera Cir
- 556 Riviera Cir
- 572 Riviera Cir
- 579 Riviera Cir
- 549 Riviera Cir
- 568 Masters Cir
- 588 Masters Cir
- 561 Misty View Way
- 576 Riviera Cir
- 554 Misty View Way
Your Personal Tour Guide
Ask me questions while you tour the home.