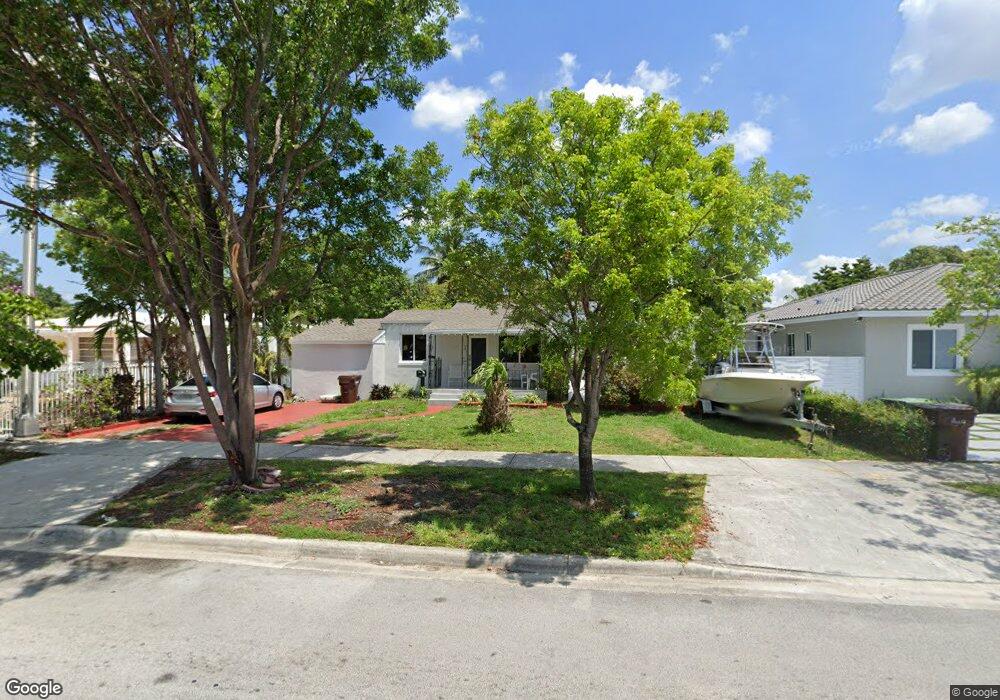
561 SE 4th St Hialeah, FL 33010
Essex Village NeighborhoodEstimated Value: $547,000 - $606,000
4
Beds
2
Baths
1,391
Sq Ft
$414/Sq Ft
Est. Value
About This Home
This home is located at 561 SE 4th St, Hialeah, FL 33010 and is currently estimated at $575,660, approximately $413 per square foot. 561 SE 4th St is a home located in Miami-Dade County with nearby schools including Lorah Park Elementary School, Miami Springs Middle School, and Miami Springs Senior High School.
Ownership History
Date
Name
Owned For
Owner Type
Purchase Details
Closed on
Aug 31, 2021
Sold by
Monte Services Corp
Bought by
Alfonso Alain Alejandro and De La Caridad
Current Estimated Value
Home Financials for this Owner
Home Financials are based on the most recent Mortgage that was taken out on this home.
Original Mortgage
$404,700
Outstanding Balance
$368,247
Interest Rate
2.8%
Mortgage Type
New Conventional
Estimated Equity
$207,413
Purchase Details
Closed on
Jan 14, 2021
Sold by
Collada Manuel Ignacio
Bought by
Monte Services Corp
Home Financials for this Owner
Home Financials are based on the most recent Mortgage that was taken out on this home.
Original Mortgage
$171,000
Interest Rate
2.65%
Mortgage Type
Commercial
Purchase Details
Closed on
May 10, 2019
Sold by
Cedeno Blanca and Diaz Elizabeth
Bought by
Cedeno Robert and Cedeno Blanca
Purchase Details
Closed on
Dec 15, 2006
Sold by
Cedeno Blanca
Bought by
Cedeno Blanca and Diaz Elizabeth
Create a Home Valuation Report for This Property
The Home Valuation Report is an in-depth analysis detailing your home's value as well as a comparison with similar homes in the area
Home Values in the Area
Average Home Value in this Area
Purchase History
| Date | Buyer | Sale Price | Title Company |
|---|---|---|---|
| Alfonso Alain Alejandro | $445,000 | New Place Title Inc | |
| Monte Services Corp | $228,000 | Posh Title Services Inc | |
| Cedeno Robert | -- | None Available | |
| Cedeno Blanca | -- | Attorney |
Source: Public Records
Mortgage History
| Date | Status | Borrower | Loan Amount |
|---|---|---|---|
| Open | Alfonso Alain Alejandro | $404,700 | |
| Previous Owner | Monte Services Corp | $171,000 |
Source: Public Records
Tax History
| Year | Tax Paid | Tax Assessment Tax Assessment Total Assessment is a certain percentage of the fair market value that is determined by local assessors to be the total taxable value of land and additions on the property. | Land | Improvement |
|---|---|---|---|---|
| 2025 | $6,348 | $392,360 | -- | -- |
| 2024 | $5,957 | $381,303 | -- | -- |
| 2023 | $5,957 | $358,455 | $0 | $0 |
| 2022 | $5,755 | $348,015 | $190,192 | $157,823 |
| 2021 | $5,454 | $282,946 | $161,765 | $121,181 |
| 2020 | $4,509 | $233,291 | $144,506 | $88,785 |
| 2019 | $691 | $106,506 | $0 | $0 |
| 2018 | $619 | $104,521 | $0 | $0 |
| 2017 | $601 | $102,372 | $0 | $0 |
| 2016 | $590 | $100,267 | $0 | $0 |
| 2015 | $607 | $99,571 | $0 | $0 |
| 2014 | $629 | $98,781 | $0 | $0 |
Source: Public Records
Map
Nearby Homes
- 591 SE 5th St
- 650 SE 1st Place
- 501 SE 1st St
- 621 SE 1st St
- 670 SE 1st St
- 683 SE 6th Place
- 39 East Dr
- 375 E Okeechobee Rd
- 712 Hialeah Dr
- 117 S Royal Poinciana Blvd
- 309 S Royal Poinciana Blvd Unit 302
- 524 S Royal Poinciana Blvd
- 101 S Royal Poinciana Blvd
- 860 SE 7th Ave
- 81 S Royal Poinciana Blvd
- 890 SE 3rd Place
- 685 SE Park Dr
- 305 E 4th Ave Unit 1
- 472 S Royal Poinciana Blvd
- 297 Minola Dr
Your Personal Tour Guide
Ask me questions while you tour the home.