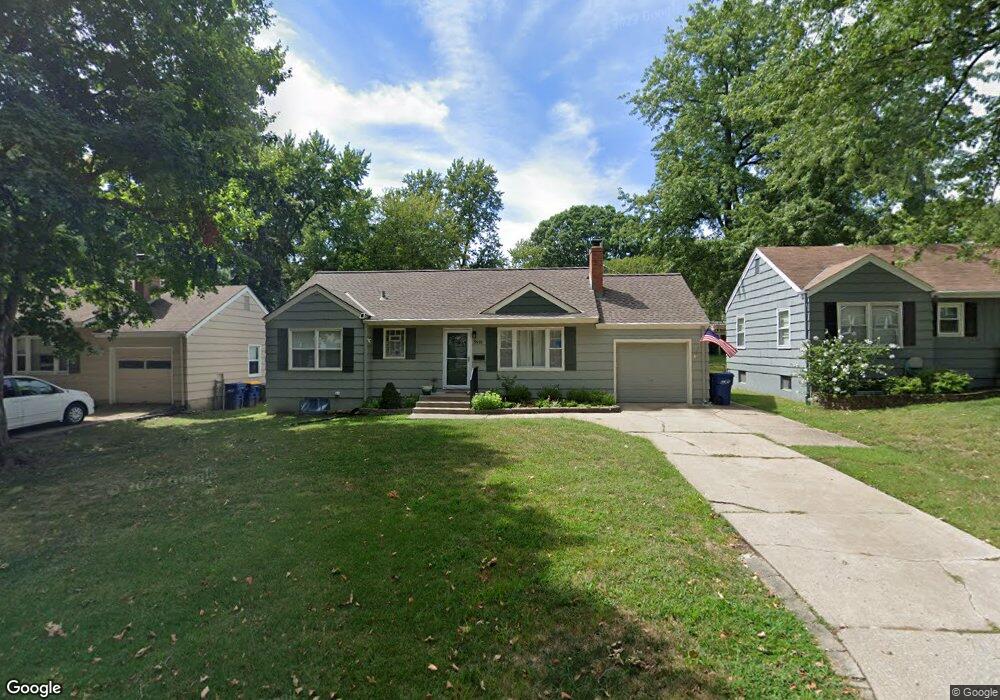
5610 Beverly Ln Mission, KS 66202
Estimated Value: $281,000 - $304,000
3
Beds
2
Baths
936
Sq Ft
$315/Sq Ft
Est. Value
About This Home
This home is located at 5610 Beverly Ln, Mission, KS 66202 and is currently estimated at $294,652, approximately $314 per square foot. 5610 Beverly Ln is a home located in Johnson County with nearby schools including Rushton Elementary School, Hocker Grove Middle School, and Shawnee Mission North High School.
Ownership History
Date
Name
Owned For
Owner Type
Purchase Details
Closed on
Aug 5, 2025
Sold by
Madden Cara
Bought by
Tribble Cara and Tribble Joshua
Current Estimated Value
Purchase Details
Closed on
Feb 17, 2016
Sold by
Double A Property Llc
Bought by
Madden Cara A
Purchase Details
Closed on
Jun 3, 2010
Sold by
Bozarth Adrian and Bozarth Andrea
Bought by
Double A Property Llc
Purchase Details
Closed on
May 24, 2010
Sold by
Cano Rosalba and Martinez Antonio
Bought by
Bozarth Adrian and Bozarth Andrea
Purchase Details
Closed on
Jul 21, 2003
Sold by
Tripp Donald R
Bought by
Cano Rosalba
Home Financials for this Owner
Home Financials are based on the most recent Mortgage that was taken out on this home.
Original Mortgage
$127,991
Interest Rate
5.51%
Mortgage Type
FHA
Create a Home Valuation Report for This Property
The Home Valuation Report is an in-depth analysis detailing your home's value as well as a comparison with similar homes in the area
Home Values in the Area
Average Home Value in this Area
Purchase History
| Date | Buyer | Sale Price | Title Company |
|---|---|---|---|
| Tribble Cara | -- | None Listed On Document | |
| Tribble Cara | -- | None Listed On Document | |
| Madden Cara A | -- | Platinum Title | |
| Double A Property Llc | -- | Kansas City Title | |
| Bozarth Adrian | -- | Kansas City Title | |
| Cano Rosalba | -- | Multiple |
Source: Public Records
Mortgage History
| Date | Status | Borrower | Loan Amount |
|---|---|---|---|
| Previous Owner | Cano Rosalba | $127,991 |
Source: Public Records
Tax History Compared to Growth
Tax History
| Year | Tax Paid | Tax Assessment Tax Assessment Total Assessment is a certain percentage of the fair market value that is determined by local assessors to be the total taxable value of land and additions on the property. | Land | Improvement |
|---|---|---|---|---|
| 2024 | $3,965 | $31,763 | $7,996 | $23,767 |
| 2023 | $3,656 | $28,451 | $7,266 | $21,185 |
| 2022 | $3,451 | $28,957 | $6,603 | $22,354 |
| 2021 | $3,322 | $24,690 | $5,507 | $19,183 |
| 2020 | $3,122 | $22,621 | $4,789 | $17,832 |
| 2019 | $2,988 | $21,436 | $3,197 | $18,239 |
| 2018 | $2,887 | $20,378 | $3,197 | $17,181 |
| 2017 | $2,607 | $17,791 | $3,197 | $14,594 |
| 2016 | $2,095 | $13,421 | $3,197 | $10,224 |
| 2015 | $2,054 | $13,168 | $3,197 | $9,971 |
| 2013 | -- | $12,271 | $3,197 | $9,074 |
Source: Public Records
Map
Nearby Homes
- 5701 Russell St
- 5729 Dearborn St
- 5431 Woodson Rd
- 6620 W 56th St
- 5504 Glenwood St
- 5434 Maple St
- 5429 Maple St
- 5335 Maple St
- 5400 W 58th St
- 5312 W 58th St
- 5217 Walmer St
- 6611 Florence St
- 6615 Florence St
- 6614 Florence St
- 5940 Nall Ave
- 6610 Florence St
- 5201 Riggs St
- 5702 Metcalf Ct
- 5126 Russell St
- 5737 Metcalf Ct Unit 25
- 5606 Beverly Ln
- 5616 Beverly Ln
- 5611 Horton St
- 5605 Horton St
- 6119 W 56th St
- 5620 Beverly Ln
- 5617 Horton St
- 5611 Beverly Ln
- 5601 Horton St
- 5607 Beverly Ln
- 5617 Beverly Ln
- 5623 Horton St
- 5624 Beverly Ln
- 6107 W 56th St
- 5621 Beverly Ln
- 6116 W 56th St
- 5629 Horton St
- 5625 Beverly Ln
- 5630 Beverly Ln
- 6120 W 56th St