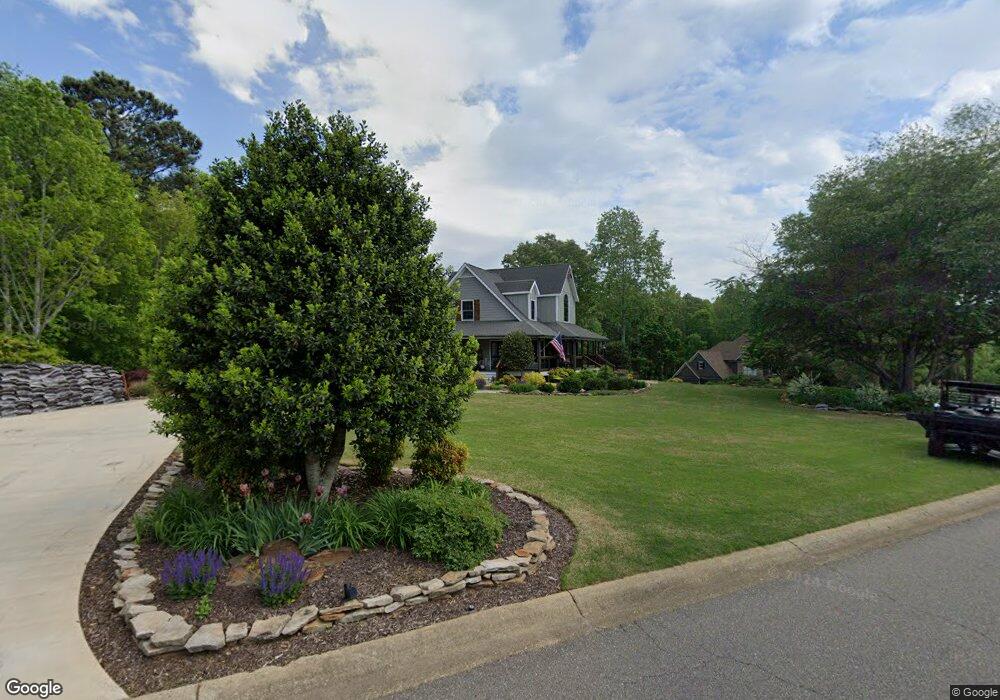
5610 Chestatee Landing Dr Gainesville, GA 30506
Estimated Value: $485,000 - $759,000
3
Beds
2
Baths
2,078
Sq Ft
$285/Sq Ft
Est. Value
About This Home
This home is located at 5610 Chestatee Landing Dr, Gainesville, GA 30506 and is currently estimated at $592,144, approximately $284 per square foot. 5610 Chestatee Landing Dr is a home located in Forsyth County with nearby schools including Chestatee Elementary School and Little Mill Middle School.
Ownership History
Date
Name
Owned For
Owner Type
Purchase Details
Closed on
Sep 30, 1999
Sold by
Sterling Charles W
Bought by
Sterling Charles W and Sterling Debra C
Current Estimated Value
Home Financials for this Owner
Home Financials are based on the most recent Mortgage that was taken out on this home.
Original Mortgage
$217,800
Outstanding Balance
$90,281
Interest Rate
12.8%
Mortgage Type
New Conventional
Estimated Equity
$501,863
Purchase Details
Closed on
Jun 25, 1998
Sold by
Thomas Supply Co
Bought by
L L Stone Inc
Home Financials for this Owner
Home Financials are based on the most recent Mortgage that was taken out on this home.
Original Mortgage
$178,500
Interest Rate
7.02%
Mortgage Type
New Conventional
Create a Home Valuation Report for This Property
The Home Valuation Report is an in-depth analysis detailing your home's value as well as a comparison with similar homes in the area
Home Values in the Area
Average Home Value in this Area
Purchase History
| Date | Buyer | Sale Price | Title Company |
|---|---|---|---|
| Sterling Charles W | -- | -- | |
| Sterling Charles W | $242,000 | -- | |
| L L Stone Inc | $36,000 | -- |
Source: Public Records
Mortgage History
| Date | Status | Borrower | Loan Amount |
|---|---|---|---|
| Open | Sterling Charles W | $217,800 | |
| Previous Owner | L L Stone Inc | $178,500 |
Source: Public Records
Tax History Compared to Growth
Tax History
| Year | Tax Paid | Tax Assessment Tax Assessment Total Assessment is a certain percentage of the fair market value that is determined by local assessors to be the total taxable value of land and additions on the property. | Land | Improvement |
|---|---|---|---|---|
| 2025 | $4,039 | $207,916 | $46,000 | $161,916 |
| 2024 | $4,039 | $191,620 | $34,000 | $157,620 |
| 2023 | $3,874 | $202,380 | $26,000 | $176,380 |
| 2022 | $3,790 | $142,744 | $10,000 | $132,744 |
| 2021 | $3,647 | $142,744 | $10,000 | $132,744 |
| 2020 | $3,446 | $133,000 | $14,000 | $119,000 |
| 2019 | $3,431 | $132,060 | $14,000 | $118,060 |
| 2018 | $3,286 | $124,680 | $14,000 | $110,680 |
| 2017 | $3,090 | $114,828 | $14,000 | $100,828 |
| 2016 | $3,090 | $114,828 | $14,000 | $100,828 |
| 2015 | $3,095 | $114,828 | $14,000 | $100,828 |
| 2014 | $2,785 | $108,504 | $16,000 | $92,504 |
Source: Public Records
Map
Nearby Homes
- 6155 Quail Mountain Trail
- 5620 Truman Mountain Rd
- 5716 Quail Mountain Trail
- 0 Crooked O Trail Unit 7666229
- 0 Quail Mountain Trail Unit 10626010
- 6035 Lakeside Ct
- 0 Lakeview Ct Unit 7686153
- 0 Lakeview Ct Unit 10649891
- 5955 Truman Mountain Rd
- 0 Crooked Trail Unit 7652725
- 0 Crooked Trail Unit 10608235
- 0 Tomahawk Terrace Unit 10653462
- 6600 Crystal Cove Trail
- 4985 Truman Mountain Rd
- 0 Old Still Trail Unit 10619540
- 0 Old Still Trail Unit 10619492
- 0 Old Still Trail Unit 10619552
- 4260 Dawsonville Hwy
- 0 Lake Harbor Trail Unit 10561936
- 3722 Wavespray Ct
- 5630 Chestatee Landing Dr
- LOT 43 Chestatee Landing Dr
- LOT 11 Chestatee Landing Dr
- 5545 Chestatee Landing Way
- 5545 Chestatee Lndg Way
- 5540 Chestatee Landing Way
- 5615 Chestatee Landing Dr
- 5640 Chestatee Landing Dr
- 5625 Chestatee Landing Dr
- 5635 Chestatee Landing Dr
- 5595 Chestatee Landing Dr
- 5650 Chestatee Landing Dr
- 5605 Chestatee Landing Dr
- 5530 Chestatee Landing Way
- 5605 Chestatee Landing
- 5575 Chestatee Landing Dr
- 5575 Chestatee Landing Dr Unit 18
- 5585 Chestatee Landing Dr
- 5515 Chestatee Landing Way Unit 10
- 5515 Chestatee Landing Way Unit 10