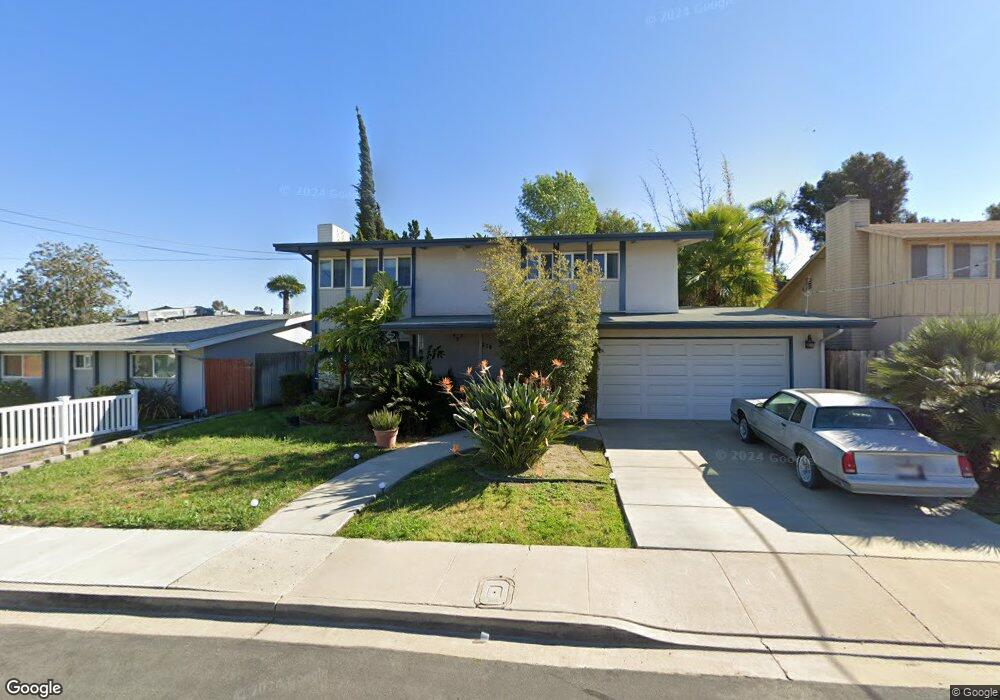
5610 Morro Way La Mesa, CA 91942
Estimated Value: $820,000 - $862,000
3
Beds
2
Baths
1,550
Sq Ft
$542/Sq Ft
Est. Value
About This Home
This home is located at 5610 Morro Way, La Mesa, CA 91942 and is currently estimated at $840,012, approximately $541 per square foot. 5610 Morro Way is a home located in San Diego County with nearby schools including Murray Manor Elementary School, Parkway Academy, and Grossmont High School.
Ownership History
Date
Name
Owned For
Owner Type
Purchase Details
Closed on
Jun 7, 2024
Sold by
Joshua Arlyn Miller Family Trust and Miller Kevin A
Bought by
Ramadan Sultan and Fattah Raya
Current Estimated Value
Home Financials for this Owner
Home Financials are based on the most recent Mortgage that was taken out on this home.
Original Mortgage
$707,670
Outstanding Balance
$698,760
Interest Rate
7.09%
Mortgage Type
New Conventional
Estimated Equity
$141,252
Purchase Details
Closed on
Dec 13, 2023
Sold by
Miller Kevin A and Miller Elizabeth A
Bought by
Joshua Arlyn Miller Family Trust and Miller
Purchase Details
Closed on
Sep 7, 1993
Sold by
Petersen Ray Lloyd
Bought by
Miller Kevin A
Home Financials for this Owner
Home Financials are based on the most recent Mortgage that was taken out on this home.
Original Mortgage
$156,750
Interest Rate
6.94%
Create a Home Valuation Report for This Property
The Home Valuation Report is an in-depth analysis detailing your home's value as well as a comparison with similar homes in the area
Home Values in the Area
Average Home Value in this Area
Purchase History
| Date | Buyer | Sale Price | Title Company |
|---|---|---|---|
| Ramadan Sultan | $786,500 | Ticor Title | |
| Joshua Arlyn Miller Family Trust | -- | None Listed On Document | |
| Miller Kevin A | -- | None Listed On Document | |
| Miller Kevin A | $165,000 | Southland Title Corporation |
Source: Public Records
Mortgage History
| Date | Status | Borrower | Loan Amount |
|---|---|---|---|
| Open | Ramadan Sultan | $707,670 | |
| Previous Owner | Miller Kevin A | $156,750 |
Source: Public Records
Tax History Compared to Growth
Tax History
| Year | Tax Paid | Tax Assessment Tax Assessment Total Assessment is a certain percentage of the fair market value that is determined by local assessors to be the total taxable value of land and additions on the property. | Land | Improvement |
|---|---|---|---|---|
| 2025 | $4,089 | $802,026 | $510,000 | $292,026 |
| 2024 | $4,089 | $274,923 | $166,623 | $108,300 |
| 2023 | $3,907 | $269,533 | $163,356 | $106,177 |
| 2022 | $3,907 | $264,249 | $160,153 | $104,096 |
| 2021 | $3,855 | $259,068 | $157,013 | $102,055 |
| 2020 | $3,767 | $256,413 | $155,404 | $101,009 |
| 2019 | $3,673 | $251,386 | $152,357 | $99,029 |
| 2018 | $3,593 | $246,458 | $149,370 | $97,088 |
| 2017 | $50 | $241,627 | $146,442 | $95,185 |
| 2016 | $3,406 | $236,890 | $143,571 | $93,319 |
| 2015 | $3,360 | $233,333 | $141,415 | $91,918 |
| 2014 | $3,251 | $228,763 | $138,645 | $90,118 |
Source: Public Records
Map
Nearby Homes
- 5760 Marengo Ave
- 5350 Baltimore Dr Unit 20
- 5350 Baltimore Dr Unit 58
- 5350 Baltimore Dr Unit 47
- 5440 Baltimore Dr Unit 161
- 5440 Baltimore Dr Unit 90
- 5440 Baltimore Dr Unit 178
- 5661 Lake Park Way Unit 4
- 7780 Parkway Dr Unit 304
- 5430 Baltimore Dr
- 5430 Baltimore Dr Unit 36
- 5430 Baltimore Dr Unit 51
- 5800 Lake Murray Blvd Unit 83
- 8100 Place
- 7700 Parkway Dr Unit 17
- 5590 Shasta Ln
- 7750 Ropalt St
- Lot 48 Guava
- 5091 Guava Ave
- 5700 Baltimore Dr Unit 215
- 5620 Morro Way
- 5600 Morro Way
- 5590 Morro Way
- 5630 Morro Way
- 5586 Morro Way
- 8020 Morocco Dr
- 8014 Morocco Dr
- 5631 Morro Way
- 8008 Morocco Dr
- 5621 Morro Way
- 8030 Morocco Dr
- 5641 Morro Way
- 7960 Soper Ln
- 5580 Morro Way
- 5611 Morro Way
- 5601 Morro Way
- 7961 Soper Ln
- 5595 Morro Way
- 7950 Soper Ln
- 5587 Morro Way