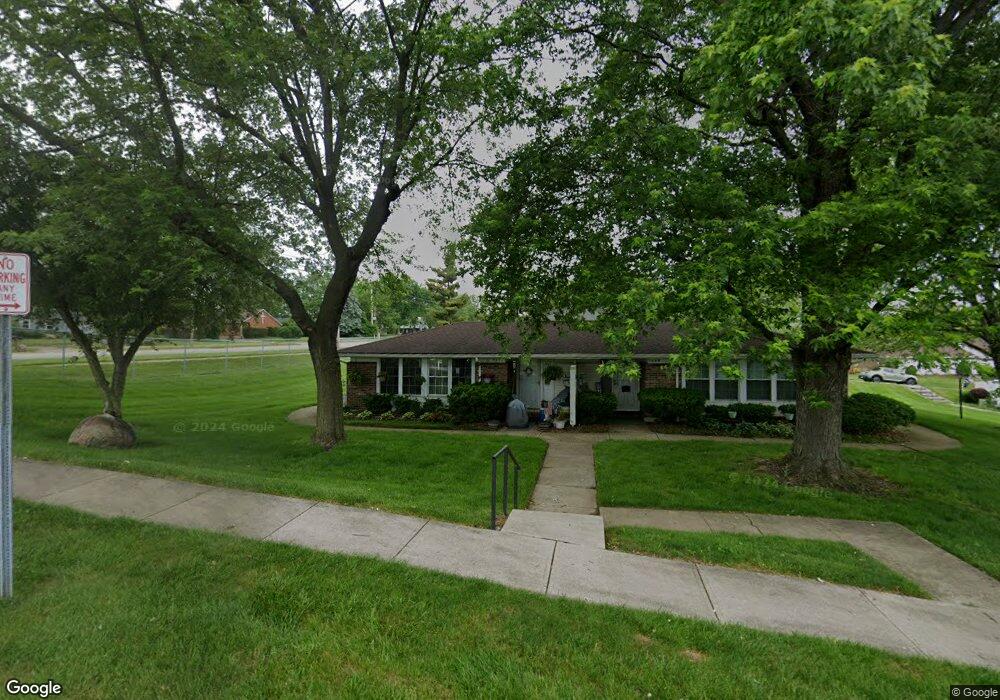
5611 Troy Villa Blvd Unit 20105 Dayton, OH 45424
Estimated Value: $106,000 - $122,000
2
Beds
2
Baths
937
Sq Ft
$121/Sq Ft
Est. Value
About This Home
This home is located at 5611 Troy Villa Blvd Unit 20105, Dayton, OH 45424 and is currently estimated at $113,717, approximately $121 per square foot. 5611 Troy Villa Blvd Unit 20105 is a home located in Montgomery County with nearby schools including Wayne High School and Huber Heights Christian Academy.
Ownership History
Date
Name
Owned For
Owner Type
Purchase Details
Closed on
Apr 21, 2010
Sold by
Secretary Of Housing & Urban Development
Bought by
Coover Richard J and Coover Janet F
Current Estimated Value
Home Financials for this Owner
Home Financials are based on the most recent Mortgage that was taken out on this home.
Original Mortgage
$24,520
Outstanding Balance
$16,347
Interest Rate
5.02%
Mortgage Type
New Conventional
Estimated Equity
$97,370
Purchase Details
Closed on
Nov 2, 2009
Sold by
Midfirst Bank
Bought by
Secretary Of Housing & Urban Development
Purchase Details
Closed on
Oct 19, 2009
Sold by
Haag Robert
Bought by
Midfirst Bank
Purchase Details
Closed on
Mar 27, 2001
Sold by
Hodges Randy S
Bought by
Haag Robert A
Home Financials for this Owner
Home Financials are based on the most recent Mortgage that was taken out on this home.
Original Mortgage
$57,230
Interest Rate
7.05%
Mortgage Type
FHA
Purchase Details
Closed on
Mar 31, 1994
Sold by
Richard Angela E
Bought by
Hodges Nancy J
Create a Home Valuation Report for This Property
The Home Valuation Report is an in-depth analysis detailing your home's value as well as a comparison with similar homes in the area
Home Values in the Area
Average Home Value in this Area
Purchase History
| Date | Buyer | Sale Price | Title Company |
|---|---|---|---|
| Coover Richard J | $30,650 | Attorney | |
| Secretary Of Housing & Urban Development | -- | None Available | |
| Midfirst Bank | $38,000 | None Available | |
| Haag Robert A | $59,000 | -- | |
| Hodges Nancy J | -- | Equity Title |
Source: Public Records
Mortgage History
| Date | Status | Borrower | Loan Amount |
|---|---|---|---|
| Open | Coover Richard J | $24,520 | |
| Previous Owner | Haag Robert A | $57,230 |
Source: Public Records
Tax History Compared to Growth
Tax History
| Year | Tax Paid | Tax Assessment Tax Assessment Total Assessment is a certain percentage of the fair market value that is determined by local assessors to be the total taxable value of land and additions on the property. | Land | Improvement |
|---|---|---|---|---|
| 2024 | $1,315 | $24,680 | $4,090 | $20,590 |
| 2023 | $1,315 | $24,680 | $4,090 | $20,590 |
| 2022 | $1,146 | $16,900 | $2,800 | $14,100 |
| 2021 | $1,160 | $16,900 | $2,800 | $14,100 |
| 2020 | $1,161 | $16,900 | $2,800 | $14,100 |
| 2019 | $1,043 | $13,380 | $2,800 | $10,580 |
| 2018 | $1,046 | $13,380 | $2,800 | $10,580 |
| 2017 | $1,040 | $13,380 | $2,800 | $10,580 |
| 2016 | $1,271 | $16,030 | $2,800 | $13,230 |
| 2015 | $1,255 | $16,030 | $2,800 | $13,230 |
| 2014 | $1,255 | $16,030 | $2,800 | $13,230 |
| 2012 | -- | $19,340 | $4,200 | $15,140 |
Source: Public Records
Map
Nearby Homes
- 5637 Troy Villa Blvd Unit 20088
- 6851 Locustview Dr
- 5904 Troy Villa Blvd Unit 20051
- 5873 Troy Villa Blvd Unit 20174
- 5631 Longford Rd
- 6600 Green Lee Ct
- 6514 Wrenview Ct
- 5582 Camerford Dr
- 6246 Old Troy Pike
- 6529 Harshmanville Rd
- 4944 Chesham Dr
- 5580 Clagston Ct
- 5135 Chesham Dr
- 6220 Aaron Ln
- 7077 Sandalview Dr
- 5248 Tilbury Rd
- 4931 Longford Rd
- 7500 Mount Ranier Unit 12077
- 7126 Mandrake Dr
- 6686 Oakwood Ln
- 5615 Troy Villa Blvd Unit 20107
- 5609 Troy Villa Blvd Unit 20106
- 5613 Troy Villa Blvd Unit 20104
- 5607 Troy Villa Blvd Unit 20111
- 5603 Troy Villa Blvd Unit 20109
- 5605 Troy Villa Blvd Unit 20108
- 6865 Troy Pike
- 6855 Troy Pike
- 5645 Troy Villa Blvd Unit 20096
- 5641 Troy Villa Blvd Unit 20098
- 5643 Troy Villa Blvd Unit 20097
- 5647 Troy Villa Blvd Unit 20099
- 5695 Troy Villa Blvd Unit 20115
- 6815 Troy Pike
- 5689 Troy Villa Blvd Unit 20114
- 5691 Troy Villa Blvd Unit 20113
- 5693 Troy Villa Blvd Unit 20112
- 5635 Troy Villa Blvd Unit 20089
- 5655 Troy Villa Blvd Unit 20103
- 5653 Troy Villa Blvd Unit 20100