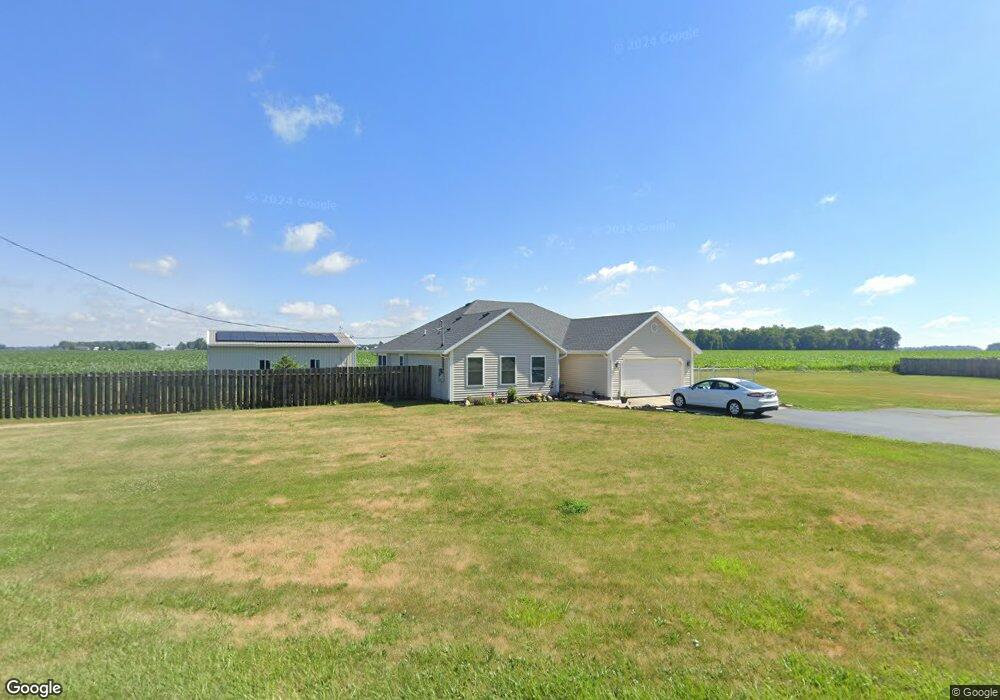
5611 W State Route 41 Covington, OH 45318
Estimated Value: $254,000 - $311,000
3
Beds
2
Baths
1,551
Sq Ft
$182/Sq Ft
Est. Value
About This Home
This home is located at 5611 W State Route 41, Covington, OH 45318 and is currently estimated at $281,806, approximately $181 per square foot. 5611 W State Route 41 is a home located in Miami County with nearby schools including Covington Elementary/Junior High School, Covington Junior High School, and Covington High School.
Ownership History
Date
Name
Owned For
Owner Type
Purchase Details
Closed on
Oct 30, 2021
Sold by
Jones Kimberly and Kimberly Jones
Bought by
Jones Jimmie and Jones Kimberly A
Current Estimated Value
Home Financials for this Owner
Home Financials are based on the most recent Mortgage that was taken out on this home.
Original Mortgage
$190,000
Outstanding Balance
$171,214
Interest Rate
2.88%
Mortgage Type
New Conventional
Estimated Equity
$110,592
Purchase Details
Closed on
Oct 20, 2021
Sold by
Jones Jim and Jones Kimberly
Bought by
Jones Jimmie D and Jones Kimberly A
Home Financials for this Owner
Home Financials are based on the most recent Mortgage that was taken out on this home.
Original Mortgage
$190,000
Outstanding Balance
$171,214
Interest Rate
2.88%
Mortgage Type
New Conventional
Estimated Equity
$110,592
Purchase Details
Closed on
Aug 20, 2019
Sold by
Jones Jim and Jones Kimberly
Bought by
Jones Jim and Jones Kimberly
Home Financials for this Owner
Home Financials are based on the most recent Mortgage that was taken out on this home.
Original Mortgage
$164,536
Interest Rate
3.8%
Mortgage Type
New Conventional
Purchase Details
Closed on
Nov 25, 2009
Sold by
Swink Randy J and Swink Lora L
Bought by
Swink Randy J and Swink Lora L
Create a Home Valuation Report for This Property
The Home Valuation Report is an in-depth analysis detailing your home's value as well as a comparison with similar homes in the area
Purchase History
| Date | Buyer | Sale Price | Title Company |
|---|---|---|---|
| Jones Jimmie | -- | None Listed On Document | |
| Jones Jimmie D | -- | Bchh Inc | |
| Jones Jim | -- | None Available | |
| Swink Randy J | -- | -- |
Source: Public Records
Mortgage History
| Date | Status | Borrower | Loan Amount |
|---|---|---|---|
| Open | Jones Jimmie | $190,000 | |
| Closed | Jones Jimmie D | $190,000 | |
| Previous Owner | Jones Jim | $164,536 |
Source: Public Records
Tax History
| Year | Tax Paid | Tax Assessment Tax Assessment Total Assessment is a certain percentage of the fair market value that is determined by local assessors to be the total taxable value of land and additions on the property. | Land | Improvement |
|---|---|---|---|---|
| 2025 | $3,147 | $91,290 | $11,450 | $79,840 |
| 2024 | $3,147 | $66,750 | $8,230 | $58,520 |
| 2023 | $2,288 | $66,750 | $8,230 | $58,520 |
| 2022 | $2,317 | $66,750 | $8,230 | $58,520 |
| 2021 | $2,063 | $55,620 | $6,860 | $48,760 |
| 2020 | $2,068 | $55,620 | $6,860 | $48,760 |
| 2019 | $1,991 | $55,620 | $6,860 | $48,760 |
| 2018 | $1,526 | $45,050 | $6,790 | $38,260 |
| 2017 | $1,559 | $45,050 | $6,790 | $38,260 |
| 2016 | $1,532 | $45,050 | $6,790 | $38,260 |
| 2015 | $1,500 | $43,340 | $6,550 | $36,790 |
| 2014 | $1,500 | $43,340 | $6,550 | $36,790 |
| 2013 | $1,508 | $43,340 | $6,550 | $36,790 |
Source: Public Records
Map
Nearby Homes
- 6365 W State Route 41
- 2025 N Forest Hill Rd
- 219 Henry Ct
- 221 Henry Ct
- 207 Charles Ct
- 212 Charles Ct
- 210 Charles Ct
- 205 Charles Ct
- 208 Charles Ct
- 6665 W US Route 36
- 203 Charles Ct
- 201 Charles Ct
- 206 Charles Ct
- 204 Charles Ct
- 200 Charles Ct
- 202 Charles Ct
- 4400 N Washington Rd
- 305 Sharon St
- 309 Ullery Dr
- 120 N Grant St
- 5593 W State Route 41
- 5590 W State Route 41
- 5620 W State Route 41
- 3666 N Martin Rd
- 5821 W State Route 41
- 5645 W Myers Rd
- 5665 W Myers Rd
- 5685 W Myers Rd
- 3510 N Martin Rd
- 5733 W Myers Rd
- 5711 W Myers Rd
- 5785 W Myers Rd
- 5825 W Myers Rd
- 5905 W State Route 41
- 5855 W Myers Rd
- 5875 W Myers Rd
- 5930 W State Route 41
- 5927 W State Route 41
- 5910 W State Route 41
- 5925 W Myers Rd
Your Personal Tour Guide
Ask me questions while you tour the home.