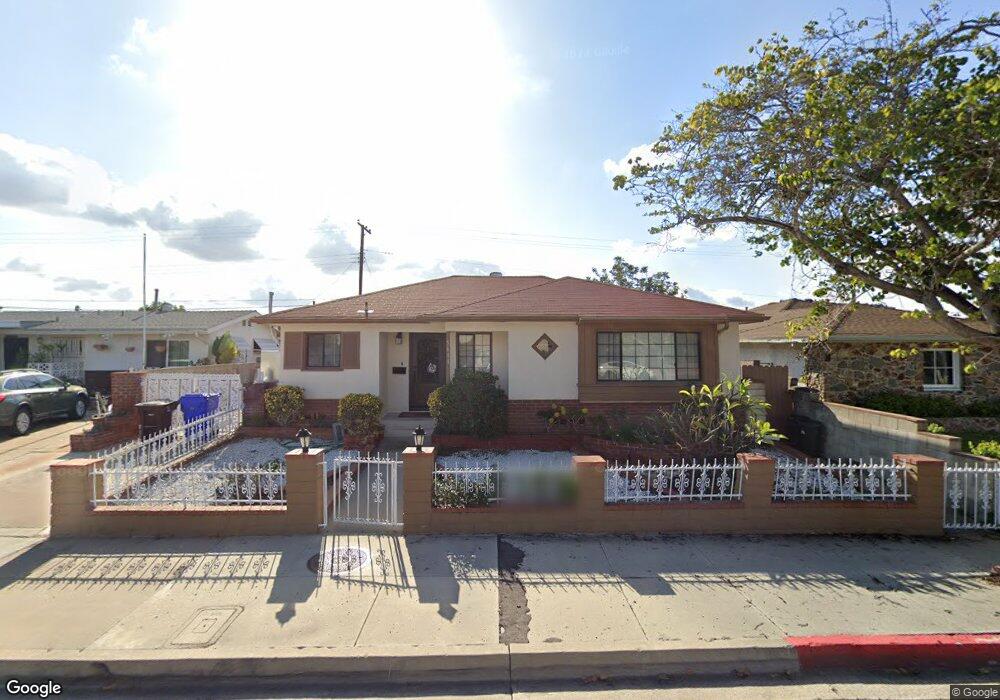
5611 Waring Rd San Diego, CA 92120
Allied Gardens NeighborhoodEstimated Value: $828,042 - $940,000
3
Beds
2
Baths
1,125
Sq Ft
$784/Sq Ft
Est. Value
About This Home
This home is located at 5611 Waring Rd, San Diego, CA 92120 and is currently estimated at $881,761, approximately $783 per square foot. 5611 Waring Rd is a home located in San Diego County with nearby schools including Marvin Elementary School, Lewis Middle School, and Patrick Henry High School.
Ownership History
Date
Name
Owned For
Owner Type
Purchase Details
Closed on
Nov 7, 2025
Sold by
Elias Lamia
Bought by
Elias Living Trust and Elias
Current Estimated Value
Purchase Details
Closed on
Nov 6, 2025
Sold by
Kashou Linda J
Bought by
Elias Lamia
Purchase Details
Closed on
Jul 20, 2011
Sold by
Kashou Linda J
Bought by
Kashou Linda J
Purchase Details
Closed on
Jun 21, 2011
Sold by
Elias Lamia
Bought by
Kashou Linda J
Purchase Details
Closed on
Jun 17, 2000
Sold by
Elias Bahij I and Elias Lamia B
Bought by
Elias Bahij and Elias Lamia
Purchase Details
Closed on
Mar 14, 2000
Sold by
Elias Bahij I and Elias Lamia B
Bought by
Elias Bahij and Elias Lamia
Home Financials for this Owner
Home Financials are based on the most recent Mortgage that was taken out on this home.
Original Mortgage
$104,000
Interest Rate
8.38%
Purchase Details
Closed on
Aug 31, 1999
Sold by
Elias Bahij I and Elias Lamia B
Bought by
Elias Bahij and Elias Lamia
Purchase Details
Closed on
May 11, 1999
Sold by
Elias Bahij I and Elias Lamia B
Bought by
Elias Bahij and Elias Lamia
Create a Home Valuation Report for This Property
The Home Valuation Report is an in-depth analysis detailing your home's value as well as a comparison with similar homes in the area
Home Values in the Area
Average Home Value in this Area
Purchase History
| Date | Buyer | Sale Price | Title Company |
|---|---|---|---|
| Elias Living Trust | -- | None Listed On Document | |
| Elias Lamia | -- | None Listed On Document | |
| Kashou Linda J | -- | None Listed On Document | |
| Kashou Linda J | -- | None Available | |
| Kashou Linda J | -- | None Available | |
| Elias Bahij | -- | -- | |
| Elias Bahij | -- | South Coast Title Company | |
| Elias Bahij | -- | -- | |
| Elias Bahij | -- | -- |
Source: Public Records
Mortgage History
| Date | Status | Borrower | Loan Amount |
|---|---|---|---|
| Previous Owner | Elias Bahij | $104,000 |
Source: Public Records
Tax History Compared to Growth
Tax History
| Year | Tax Paid | Tax Assessment Tax Assessment Total Assessment is a certain percentage of the fair market value that is determined by local assessors to be the total taxable value of land and additions on the property. | Land | Improvement |
|---|---|---|---|---|
| 2025 | $786 | $62,316 | $20,067 | $42,249 |
| 2024 | $786 | $61,095 | $19,674 | $41,421 |
| 2023 | $767 | $59,898 | $19,289 | $40,609 |
| 2022 | $747 | $58,724 | $18,911 | $39,813 |
| 2021 | $742 | $57,574 | $18,541 | $39,033 |
| 2020 | $734 | $56,984 | $18,351 | $38,633 |
| 2019 | $721 | $55,868 | $17,992 | $37,876 |
| 2018 | $676 | $54,774 | $17,640 | $37,134 |
| 2017 | $80 | $53,701 | $17,295 | $36,406 |
| 2016 | $648 | $52,649 | $16,956 | $35,693 |
| 2015 | $639 | $51,859 | $16,702 | $35,157 |
| 2014 | $630 | $50,844 | $16,375 | $34,469 |
Source: Public Records
Map
Nearby Homes
- 6994 Carthage St
- 5461 Brunswick Ave
- 7173 Eldridge St
- 6817 Birchwood St
- 5946 Crow Ct
- 7232 Margerum Ave
- 5424 Princess View Place
- 7414 Margerum Ave
- 6642 Eldridge St
- 7427 Margerum Ave
- 5214 Lewison Place
- 6329 Caminito Estrellado
- 6221 Brynwood Ct
- 6615 Ridge Manor Ave
- 5125 Fontaine St Unit 205
- 5125 Fontaine St Unit 105
- 6183 Rockhurst Dr
- 6436 Rancho Park Dr
- 7740 Margerum Ave Unit 204
- 4914 Zion Ave
- 5623 Waring Rd
- 5601 Waring Rd
- 5610 Barclay Ave
- 5602 Barclay Ave
- 5618 Barclay Ave
- 5635 Waring Rd
- 5626 Barclay Ave
- 5647 Waring Rd
- 5591 Waring Rd
- 5612 Waring Rd
- 5634 Barclay Ave
- 5592 Barclay Ave
- 5624 Waring Rd Unit 6
- 5602 Waring Rd
- 5602 Waring Rd
- 5636 Waring Rd
- 5581 Waring Rd
- 5659 Waring Rd
- 5609 Barclay Ave
- 5580 Barclay Ave