NOT LISTED FOR SALE

5613 Glen Ridge Bend Lithonia, GA 30058

Estimated Value: $214,000 - $236,000

3 Beds
2 Baths
1,208 Sq Ft
$189/Sq Ft Est. Value

About This Home

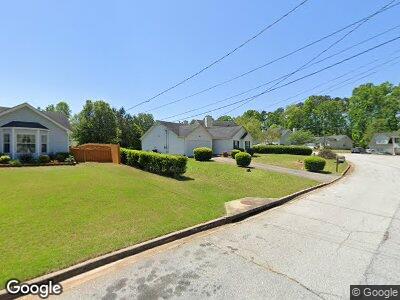
Bright/Open Floor Plan ranch you may call your home. Very nice size kitchen with Dining - view to Great Room. Great room has vaulted ceiling, fireplace. Hardwood floors Great Room, Master Bedroom, Guest Room. Tile floors in kitchen and baths. Ceiling fans all rooms (except baths). Trey in Master Bedroom. Master Bath has garden tub, separate shower, walk-in closet, water closet. Patio on back of home.

Ownership History

Date Name Owned For Owner Type

Purchase Details

Closed on
Aug 27, 2021
Sold by
4Da Enterprise Llc
Bought by
Youngblood Hannah R
Current Estimated Value
$228,835

Home Financials for this Owner

Home Financials are based on the most recent Mortgage that was taken out on this home.
Original Mortgage
$161,020
Outstanding Balance
$149,361
Interest Rate
2.8%
Mortgage Type
New Conventional
Estimated Equity
$79,587

Purchase Details

Closed on
Sep 27, 2019
Sold by
Allen Dean Q
Bought by
4Da Enterprise Llc

Purchase Details

Closed on
Dec 30, 1996
Sold by
Oakvale Heights Dev Co
Bought by
Allen Dean Q

Range of Values:

Collateral Analytics

Collateral Analytics Collateral Analytics AVMs (Automated Valuation Model) employ a number of statistical approaches combined with neighborhood-specific comparable selection guarantees the most up-to-date and precise valuations.

Not Available

Collateral Analytics does not have data for the current month. Please view the chart for historical values.

ICE

ICE Mortgage Technology ICE Mortgage Technology’s AVM (Automated Valuation Model) is a state-of-the-art online residential property valuation tool that provides a quick and accurate estimate of the value of almost any home in the U.S.

Not Available

ICE Mortgage Technology does not have data for the current month. Please view the chart for historical values.

First American

First American First American Data & Analytics’ next-generation AVM combines unrivaled data assets with a blended ensemble of valuation models to produce highly accurate, reliable valuations you can trust.

Not Available

First American does not have data for the current month. Please view the chart for historical values.

Quantarium

Quantarium Quantarium’s valuation service, repeatedly proven the industry’s most accurate and comprehensive, is supercharged with a self-learning and auto-tuning AI engine that continually becomes smarter and more accurate as it processes daily inputs from the industry’s leading RE data lake.

Not Available

Quantarium does not have data for the current month. Please view the chart for historical values.

Average Value
Not Available
List Price
Sold Price
Create a Home Valuation Report for This Property
The Home Valuation Report is an in-depth analysis detailing your home's value as well as a comparison with similar homes in the area

Home Values in the Area

Source: Public Records

Average Home Value in this Area


Source: Public Records

Purchase History

Date Buyer Sale Price Title Company
Youngblood Hannah R $166,000 --
4Da Enterprise Llc -- --
Allen Dean Q $84,900 --
Source: Public Records

Mortgage History

Date Status Borrower Loan Amount
Open Youngblood Hannah R $161,020
Closed Youngblood Hannah R $161,020
Closed Allen Dean Q $0
Source: Public Records

Property History

Date Event Price Change Sq Ft Price
08/08/2016 08/08/16 Rented $950 0.0% --
07/11/2016 07/11/16 Under Contract -- -- --
07/07/2016 07/07/16 For Rent $950 +15.2% --
07/03/2012 07/03/12 Rented $825 -24.7% --
06/03/2012 06/03/12 Under Contract -- -- --
03/08/2012 03/08/12 For Rent $1,095 -- --

Tax History Compared to Growth

Source: Public Records

Tax History

Year Tax Paid Tax Assessment Tax Assessment Total Assessment is a certain percentage of the fair market value that is determined by local assessors to be the total taxable value of land and additions on the property. Land Improvement
2023 $1,129 $77,240 $7,200 $70,040
2022 $3,282 $66,400 $6,920 $59,480
2021 $2,583 $49,720 $7,200 $42,520
2020 $2,471 $47,680 $7,200 $40,480
2019 $2,185 $41,480 $7,200 $34,280
2018 $1,768 $36,840 $4,080 $32,760
2017 $1,812 $32,840 $4,080 $28,760
2016 $1,594 $27,840 $4,080 $23,760
2014 $1,201 $18,480 $4,080 $14,400
Source: Public Records

Agents Affiliated with this Home

  • Section Image
  • Section Image
See All Agents

Map