
Seller's Agent in 2025
Valerie Sykes
Keller Williams Infinity
(313) 333-6354
1 in this area
7 Total Sales

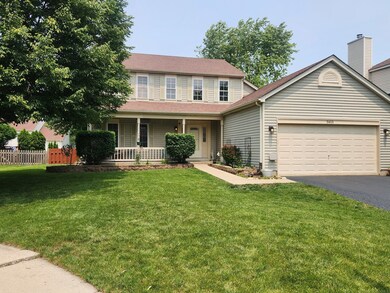
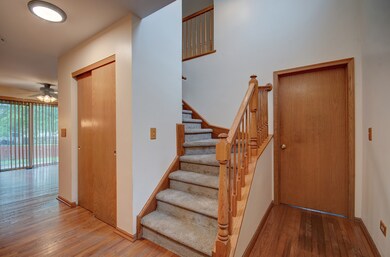
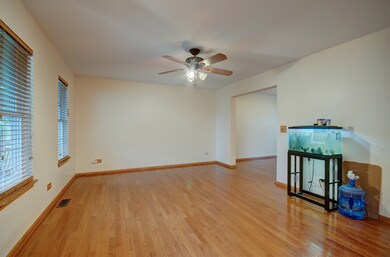
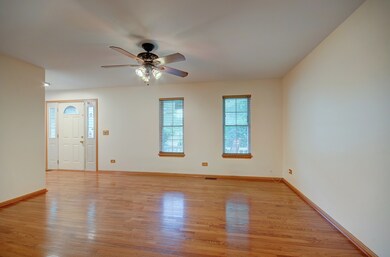
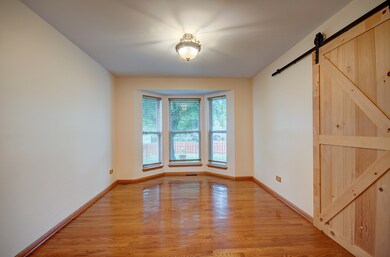

Welcome to this charming home featuring three spacious bedrooms and two and a half bathrooms. The inviting family room boasts vaulted ceilings, perfect for gatherings, while the cozy living room offers a warm retreat. Enjoy elegant hard wood floors throughout the living room, dining room, and kitchen. The formal dining room is highlighted by a beautiful bay window, adding natural light and sophistication. The kitchen is designed with rich oak cabinets, stunning granite countertops, and a convenient eat-in area. Outdoors, entertain with ease on the paver patio within the fenced-in backyard, or relax on the welcoming front porch. Plus, a partially finished basement provides extra entertainment and storage space
Last Agent to Sell the Property
Keller Williams Infinity License #475187108 Listed on: 04/04/2025
Last Buyer's Agent
@properties Christie?s International Real Estate License #475131850
| Date | Type | Sale Price | Title Company |
|---|---|---|---|
| Warranty Deed | $370,000 | Chicago Title | |
| Warranty Deed | $166,500 | -- |
| Date | Status | Loan Amount | Loan Type |
|---|---|---|---|
| Open | $370,000 | VA | |
| Previous Owner | $155,726 | FHA |
| Date | Event | Price | List to Sale | Price per Sq Ft |
|---|---|---|---|---|
| 07/18/2025 07/18/25 | Sold | $370,000 | -1.3% | $181 / Sq Ft |
| 06/14/2025 06/14/25 | For Sale | $375,000 | 0.0% | $183 / Sq Ft |
| 06/13/2025 06/13/25 | Pending | -- | -- | -- |
| 06/05/2025 06/05/25 | Price Changed | $375,000 | 0.0% | $183 / Sq Ft |
| 06/05/2025 06/05/25 | For Sale | $375,000 | +1.4% | $183 / Sq Ft |
| 05/03/2025 05/03/25 | Off Market | $370,000 | -- | -- |
| 04/24/2025 04/24/25 | Price Changed | $365,000 | -2.7% | $179 / Sq Ft |
| 04/04/2025 04/04/25 | For Sale | $375,000 | -- | $183 / Sq Ft |
| Year | Tax Paid | Tax Assessment Tax Assessment Total Assessment is a certain percentage of the fair market value that is determined by local assessors to be the total taxable value of land and additions on the property. | Land | Improvement |
|---|---|---|---|---|
| 2024 | $7,547 | $113,383 | $22,816 | $90,567 |
| 2023 | $7,547 | $102,405 | $20,607 | $81,798 |
| 2022 | $6,751 | $91,973 | $18,508 | $73,465 |
| 2021 | $6,399 | $85,956 | $17,297 | $68,659 |
| 2020 | $6,302 | $83,517 | $16,806 | $66,711 |
| 2019 | $6,081 | $79,578 | $16,013 | $63,565 |
| 2018 | $5,818 | $74,768 | $15,045 | $59,723 |
| 2017 | $5,642 | $71,052 | $14,297 | $56,755 |
| 2016 | $5,526 | $67,766 | $13,636 | $54,130 |
| 2015 | $5,227 | $63,481 | $12,774 | $50,707 |
| 2014 | $5,227 | $61,240 | $12,323 | $48,917 |
| 2013 | $5,227 | $61,240 | $12,323 | $48,917 |
Seller's Agent in 2025
Valerie Sykes
Keller Williams Infinity
(313) 333-6354
1 in this area
7 Total Sales
Buyer's Agent in 2025
Meredith Patchett
@ Properties
(773) 329-3838
4 in this area
74 Total Sales
Source: Midwest Real Estate Data (MRED)
MLS Number: 12326371
APN: 06-03-32-201-042
Disclaimer: Certain information contained herein is derived from information provided by parties other than Homes.com. All information provided is deemed reliable, but is not guaranteed to be accurate and should be independently verified.
![]() Based on information submitted to the MLS GRID. All data is obtained from various sources and may not have been verified by broker or MLS GRID. Supplied Open House Information is subject to change without notice. All information should be independently reviewed and verified for accuracy. Properties may or may not be listed by the office/agent presenting the information. Some IDX listings have been excluded from this website.
Based on information submitted to the MLS GRID. All data is obtained from various sources and may not have been verified by broker or MLS GRID. Supplied Open House Information is subject to change without notice. All information should be independently reviewed and verified for accuracy. Properties may or may not be listed by the office/agent presenting the information. Some IDX listings have been excluded from this website.
The Digital Millennium Copyright Act of 1998, 17 U.S.C. § 512 (the “DMCA”) provides recourse for copyright owners who believe that material appearing on the Internet infringes their rights under U.S. copyright law. If you believe in good faith that any content or material made available in connection with our website or services infringes your copyright, you (or your agent) may send us a notice requesting that the content or material be removed, or access to it blocked.
Notices must be sent in writing by email to DMCAnotice@MLSGrid.com.
The DMCA requires that your notice of alleged copyright infringement include the following information:
(1) description of the copyrighted work that is the subject of claimed infringement;
(2) description of the alleged infringing content and information sufficient to permit us to locate the content;
(3) contact information for you, including your address, telephone number and email address;
(4) a statement by you that you have a good faith belief that the content in the manner complained of is not authorized by the copyright owner, or its agent, or by the operation of any law;
(5) a statement by you, signed under penalty of perjury, that the information in the notification is accurate and that you have the authority to enforce the copyrights that are claimed to be infringed; and
(6) a physical or electronic signature of the copyright owner or a person authorized to act on the copyright owner’s behalf. Failure to include all of the above information may result in the delay of the processing of your complaint.