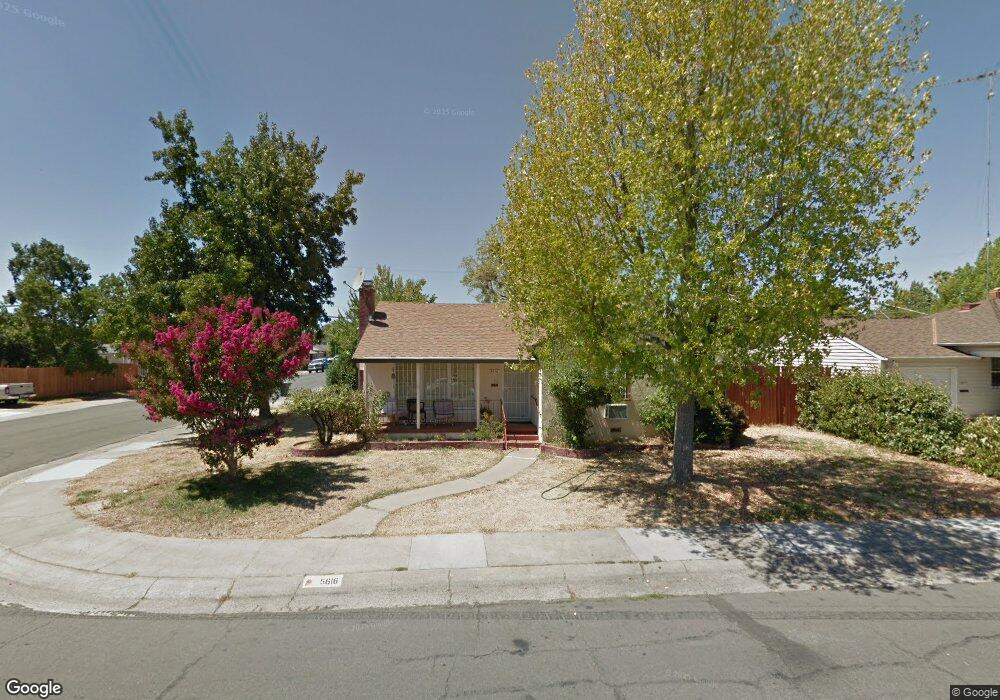
5616 59th St Sacramento, CA 95824
Fruitridge Manor NeighborhoodEstimated Value: $273,000 - $321,000
2
Beds
1
Bath
955
Sq Ft
$318/Sq Ft
Est. Value
About This Home
This home is located at 5616 59th St, Sacramento, CA 95824 and is currently estimated at $304,161, approximately $318 per square foot. 5616 59th St is a home located in Sacramento County with nearby schools including Suy:u Elementary School, Will C. Wood Middle School, and Hiram W. Johnson High School.
Ownership History
Date
Name
Owned For
Owner Type
Purchase Details
Closed on
Jan 11, 2011
Sold by
Brown Kimiko and Kojima Koji
Bought by
Yu Songtian and Zhong Huiping
Current Estimated Value
Home Financials for this Owner
Home Financials are based on the most recent Mortgage that was taken out on this home.
Original Mortgage
$46,800
Outstanding Balance
$33,345
Interest Rate
5.75%
Mortgage Type
New Conventional
Estimated Equity
$270,816
Purchase Details
Closed on
Apr 5, 2002
Sold by
Dickerman Masae
Bought by
Dickerman Masae and The Masae Dickerman Revocable
Create a Home Valuation Report for This Property
The Home Valuation Report is an in-depth analysis detailing your home's value as well as a comparison with similar homes in the area
Home Values in the Area
Average Home Value in this Area
Purchase History
| Date | Buyer | Sale Price | Title Company |
|---|---|---|---|
| Yu Songtian | $79,000 | Commerce Title Company | |
| Brown Kimiko | -- | Commerce Title Company | |
| Dickerman Masae | -- | -- |
Source: Public Records
Mortgage History
| Date | Status | Borrower | Loan Amount |
|---|---|---|---|
| Open | Brown Kimiko | $46,800 |
Source: Public Records
Tax History
| Year | Tax Paid | Tax Assessment Tax Assessment Total Assessment is a certain percentage of the fair market value that is determined by local assessors to be the total taxable value of land and additions on the property. | Land | Improvement |
|---|---|---|---|---|
| 2025 | $1,332 | $101,200 | $41,632 | $59,568 |
| 2024 | $1,332 | $99,216 | $40,816 | $58,400 |
| 2023 | $1,300 | $97,271 | $40,016 | $57,255 |
| 2022 | $1,277 | $95,365 | $39,232 | $56,133 |
| 2021 | $1,219 | $93,496 | $38,463 | $55,033 |
| 2020 | $1,225 | $92,538 | $38,069 | $54,469 |
| 2019 | $1,200 | $90,724 | $37,323 | $53,401 |
| 2018 | $1,168 | $88,946 | $36,592 | $52,354 |
| 2017 | $1,151 | $87,203 | $35,875 | $51,328 |
| 2016 | $1,103 | $85,494 | $35,172 | $50,322 |
| 2015 | $1,085 | $84,211 | $34,644 | $49,567 |
| 2014 | $1,058 | $82,563 | $33,966 | $48,597 |
Source: Public Records
Map
Nearby Homes
Your Personal Tour Guide
Ask me questions while you tour the home.