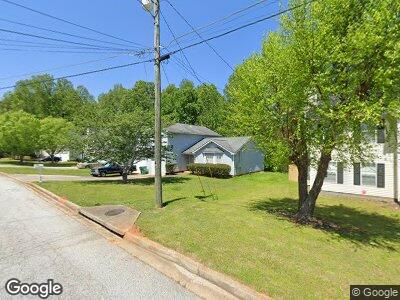
5616 Glen Ridge Bend Lithonia, GA 30058
Estimated Value: $264,000 - $291,000
3
Beds
3
Baths
2,480
Sq Ft
$112/Sq Ft
Est. Value
About This Home
This home is located at 5616 Glen Ridge Bend, Lithonia, GA 30058 and is currently estimated at $278,237, approximately $112 per square foot. 5616 Glen Ridge Bend is a home located in DeKalb County with nearby schools including Panola Way Elementary School, Miller Grove Middle School, and Miller Grove High School.
Ownership History
Date
Name
Owned For
Owner Type
Purchase Details
Closed on
Mar 24, 2003
Sold by
Deutsche Bank Natal Tu
Bought by
Peavy Sharon L
Current Estimated Value
Home Financials for this Owner
Home Financials are based on the most recent Mortgage that was taken out on this home.
Original Mortgage
$130,000
Interest Rate
5.74%
Mortgage Type
New Conventional
Purchase Details
Closed on
Mar 19, 2001
Sold by
Sec Of Va
Bought by
Smith Keith T
Home Financials for this Owner
Home Financials are based on the most recent Mortgage that was taken out on this home.
Original Mortgage
$130,150
Interest Rate
7.09%
Mortgage Type
VA
Purchase Details
Closed on
Sep 5, 2000
Sold by
First Horizon Home Loan Corp
Bought by
Sec Of Va
Purchase Details
Closed on
Jan 17, 1997
Sold by
Covington Dev Co Inc
Bought by
Harris Michael G Ann
Create a Home Valuation Report for This Property
The Home Valuation Report is an in-depth analysis detailing your home's value as well as a comparison with similar homes in the area
Home Values in the Area
Average Home Value in this Area
Purchase History
| Date | Buyer | Sale Price | Title Company |
|---|---|---|---|
| Peavy Sharon L | $130,000 | -- | |
| Smith Keith T | $130,150 | -- | |
| Sec Of Va | -- | -- | |
| First Horizon Home Loan Corp | $110,163 | -- | |
| Harris Michael G Ann | $98,900 | -- |
Source: Public Records
Mortgage History
| Date | Status | Borrower | Loan Amount |
|---|---|---|---|
| Open | Peavy Sharon L | $106,550 | |
| Closed | Peavy Sharon L | $113,500 | |
| Closed | Peavy Sharon L | $130,000 | |
| Previous Owner | Smith Keith T | $50,000 | |
| Previous Owner | Smith Keith T | $130,150 | |
| Previous Owner | Harris Michael G | $106,830 | |
| Closed | Harris Michael G Ann | $0 |
Source: Public Records
Tax History Compared to Growth
Tax History
| Year | Tax Paid | Tax Assessment Tax Assessment Total Assessment is a certain percentage of the fair market value that is determined by local assessors to be the total taxable value of land and additions on the property. | Land | Improvement |
|---|---|---|---|---|
| 2023 | $3,150 | $100,000 | $7,200 | $92,800 |
| 2022 | $2,629 | $89,480 | $7,200 | $82,280 |
| 2021 | $2,035 | $62,560 | $7,200 | $55,360 |
| 2020 | $1,800 | $54,920 | $7,200 | $47,720 |
| 2019 | $1,725 | $52,080 | $7,200 | $44,880 |
| 2018 | $1,370 | $44,320 | $4,080 | $40,240 |
| 2017 | $1,524 | $44,760 | $4,080 | $40,680 |
| 2016 | $1,267 | $38,360 | $4,080 | $34,280 |
| 2014 | $778 | $24,040 | $4,080 | $19,960 |
Source: Public Records
Map
Nearby Homes
- 5586 Cannonade Ln
- 5584 Cannonade Ln
- 2469 Briar Knoll Rd
- 2098 Mallard Crest
- 2357 Wellborn Hills Place
- 5522 Donerail St
- 5587 Strathmoor Manor Cir
- 5546 Wellborn Creek Dr
- 5445 Mallard Trail Unit 1
- 2044 Teal Cove
- 5554 Wellborn Creek Dr
- 5570 Downs Way
- 2271 Rolling Trail
- 5536 Strathmoor Manor Cir
- 5547 Strathmoor Manor Cir
- 5548 Downs Ct
- 5897 Strathmoor Manor Cir Unit I
- 5616 Glen Ridge Bend
- 5622 Glen Ridge Bend
- 5610 Glen Ridge Bend
- 5628 Glen Ridge Bend
- 2432 Briar Knoll Rd
- 2438 Briar Knoll Rd
- 5606 Glen Ridge Bend
- 5613 Glen Ridge Bend
- 2444 Briar Knoll Rd
- 2426 Briar Knoll Rd
- 5623 Glen Ridge Bend
- 5634 Glen Ridge Bend
- 5602 Glen Ridge Bend
- 5595 Glen Ridge Bend
- 5595 Glen Ridge Bend
- 2450 Briar Knoll Rd
- 2420 Briar Knoll Rd
- 5629 Glen Ridge Bend
- 0 Glen Ridge Bend Unit 7539458
- 0 Glen Ridge Bend Unit 7043391