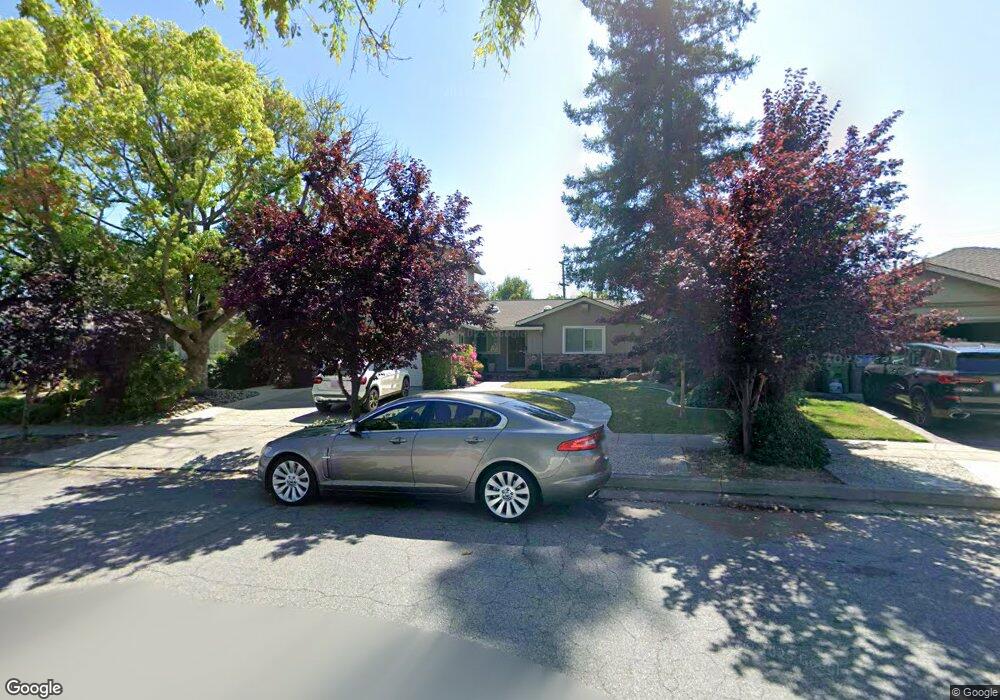
5616 Rudy Dr San Jose, CA 95124
De Voss-Leigh NeighborhoodEstimated Value: $2,049,000 - $2,143,797
4
Beds
3
Baths
2,101
Sq Ft
$999/Sq Ft
Est. Value
About This Home
This home is located at 5616 Rudy Dr, San Jose, CA 95124 and is currently estimated at $2,098,449, approximately $998 per square foot. 5616 Rudy Dr is a home located in Santa Clara County with nearby schools including Noddin Elementary School, Lietz Elementary School, and Union Middle School.
Ownership History
Date
Name
Owned For
Owner Type
Purchase Details
Closed on
Mar 25, 2015
Sold by
Le Tina and Nguyen Eric
Bought by
Kim Kyung Soo and Kwon Minyoung
Current Estimated Value
Home Financials for this Owner
Home Financials are based on the most recent Mortgage that was taken out on this home.
Original Mortgage
$757,500
Outstanding Balance
$567,940
Interest Rate
3.12%
Mortgage Type
Adjustable Rate Mortgage/ARM
Estimated Equity
$1,530,509
Purchase Details
Closed on
Jul 23, 2013
Sold by
Nguyen Eric and Le Sau
Bought by
Le Tina and Nguyen Eric
Home Financials for this Owner
Home Financials are based on the most recent Mortgage that was taken out on this home.
Original Mortgage
$640,000
Interest Rate
3.25%
Mortgage Type
FHA
Purchase Details
Closed on
Jun 24, 2013
Sold by
Le Kevin Truong
Bought by
Dinh Pauline
Home Financials for this Owner
Home Financials are based on the most recent Mortgage that was taken out on this home.
Original Mortgage
$640,000
Interest Rate
3.25%
Mortgage Type
FHA
Purchase Details
Closed on
Jun 19, 2013
Sold by
Dinh Pauline
Bought by
Nguyen Eric and Le Sau
Home Financials for this Owner
Home Financials are based on the most recent Mortgage that was taken out on this home.
Original Mortgage
$640,000
Interest Rate
3.25%
Mortgage Type
FHA
Purchase Details
Closed on
Oct 6, 2009
Sold by
Le Kevin Truong
Bought by
Dinh Pauline
Purchase Details
Closed on
Jul 23, 2009
Sold by
Dinh Pauline
Bought by
Le Kevin Truong
Purchase Details
Closed on
Aug 3, 2004
Sold by
Rinaldi Rich and Rinaldi Marcia
Bought by
Dinh Pauline
Home Financials for this Owner
Home Financials are based on the most recent Mortgage that was taken out on this home.
Original Mortgage
$544,800
Interest Rate
4.18%
Mortgage Type
Negative Amortization
Purchase Details
Closed on
Aug 13, 2003
Sold by
Rinaldi Rich and Rinaldi Marcia
Bought by
Rinaldi Rich and Rinaldi Marcia
Home Financials for this Owner
Home Financials are based on the most recent Mortgage that was taken out on this home.
Original Mortgage
$269,000
Interest Rate
5.29%
Mortgage Type
Purchase Money Mortgage
Purchase Details
Closed on
Jun 25, 2001
Sold by
Rinaldi Rich and Rinaldi Marcia R
Bought by
Rinaldi Rich and Rinaldi Marcia
Purchase Details
Closed on
Apr 13, 2001
Sold by
Rinaldi Rich and Rinaldi Marcia
Bought by
Rinaldi Richard and Rinaldi Marcia R
Home Financials for this Owner
Home Financials are based on the most recent Mortgage that was taken out on this home.
Original Mortgage
$250,000
Interest Rate
6.98%
Purchase Details
Closed on
Jul 23, 1999
Sold by
Rinaldi Richard J and Rinaldi Marcia R
Bought by
Rinaldi Rich and Rinaldi Marcia
Create a Home Valuation Report for This Property
The Home Valuation Report is an in-depth analysis detailing your home's value as well as a comparison with similar homes in the area
Home Values in the Area
Average Home Value in this Area
Purchase History
| Date | Buyer | Sale Price | Title Company |
|---|---|---|---|
| Kim Kyung Soo | $1,010,000 | Fidelity National Title Ins | |
| Le Tina | $1,341,000 | None Available | |
| Dinh Pauline | -- | Old Republic Title Company | |
| Nguyen Eric | $675,000 | Old Republic Title Company | |
| Dinh Pauline | -- | None Available | |
| Le Kevin Truong | -- | None Available | |
| Dinh Pauline | $681,000 | Fidelity National Title Ins | |
| Rinaldi Rich | -- | Commerce Title Company | |
| Rinaldi Rich | -- | North American Title Co | |
| Rinaldi Richard | -- | North American Title Co | |
| Rinaldi Rich | -- | -- |
Source: Public Records
Mortgage History
| Date | Status | Borrower | Loan Amount |
|---|---|---|---|
| Open | Kim Kyung Soo | $757,500 | |
| Previous Owner | Nguyen Eric | $640,000 | |
| Previous Owner | Dinh Pauline | $544,800 | |
| Previous Owner | Rinaldi Rich | $269,000 | |
| Previous Owner | Rinaldi Richard | $250,000 |
Source: Public Records
Tax History Compared to Growth
Tax History
| Year | Tax Paid | Tax Assessment Tax Assessment Total Assessment is a certain percentage of the fair market value that is determined by local assessors to be the total taxable value of land and additions on the property. | Land | Improvement |
|---|---|---|---|---|
| 2025 | $16,599 | $1,213,560 | $970,851 | $242,709 |
| 2024 | $16,599 | $1,189,765 | $951,815 | $237,950 |
| 2023 | $16,270 | $1,166,437 | $933,152 | $233,285 |
| 2022 | $15,934 | $1,143,566 | $914,855 | $228,711 |
| 2021 | $15,637 | $1,121,144 | $896,917 | $224,227 |
| 2020 | $15,326 | $1,109,649 | $887,721 | $221,928 |
| 2019 | $15,067 | $1,087,892 | $870,315 | $217,577 |
| 2018 | $14,696 | $1,066,561 | $853,250 | $213,311 |
| 2017 | $14,508 | $1,045,649 | $836,520 | $209,129 |
| 2016 | $13,829 | $1,025,147 | $820,118 | $205,029 |
| 2015 | $9,806 | $691,610 | $553,289 | $138,321 |
| 2014 | $9,056 | $678,063 | $542,451 | $135,612 |
Source: Public Records
Map
Nearby Homes
- 5633 Drysdale Dr
- 1705 Blossom Hill Rd
- 5743 Begonia Dr
- 1563 Dorcey Ln
- 102 Belvale Dr
- 103 Belridge Dr
- 0000 Harwood Rd
- 118 Belridge Dr
- 1796 Chevalier Dr
- 1467 Nesbit Ct
- 5813 Chambertin Dr
- 1464 Athenour Ct
- 1495 Montalban Dr
- 5066 Carter Ave
- 14510 Blossom Hill Rd
- 5051 Joseph Ln
- 1423 Dot Ct
- 1432 Montelegre Dr
- 5121 Noella Way
- 1599 Rebel Way
- 5624 Rudy Dr
- 5608 Rudy Dr
- 5617 Arbor Dell Way
- 5625 Arbor Dell Way
- 5609 Arbor Dell Way
- 5634 Rudy Dr
- 5633 Arbor Dell Way
- 5602 Rudy Dr
- 1651 Magnolia Blossom Ln
- 5601 Arbor Dell Way
- 1648 Blossom Hill Rd
- 5641 Arbor Dell Way
- 1653 Magnolia Blossom Ln
- 1650 Blossom Hill Rd
- 1623 Flower Garden Ln
- 5652 Rudy Dr
- 1654 Magnolia Blossom Ln
- 5624 Arbor Dell Way
- 5616 Arbor Dell Way
- 1655 Magnolia Blossom Ln