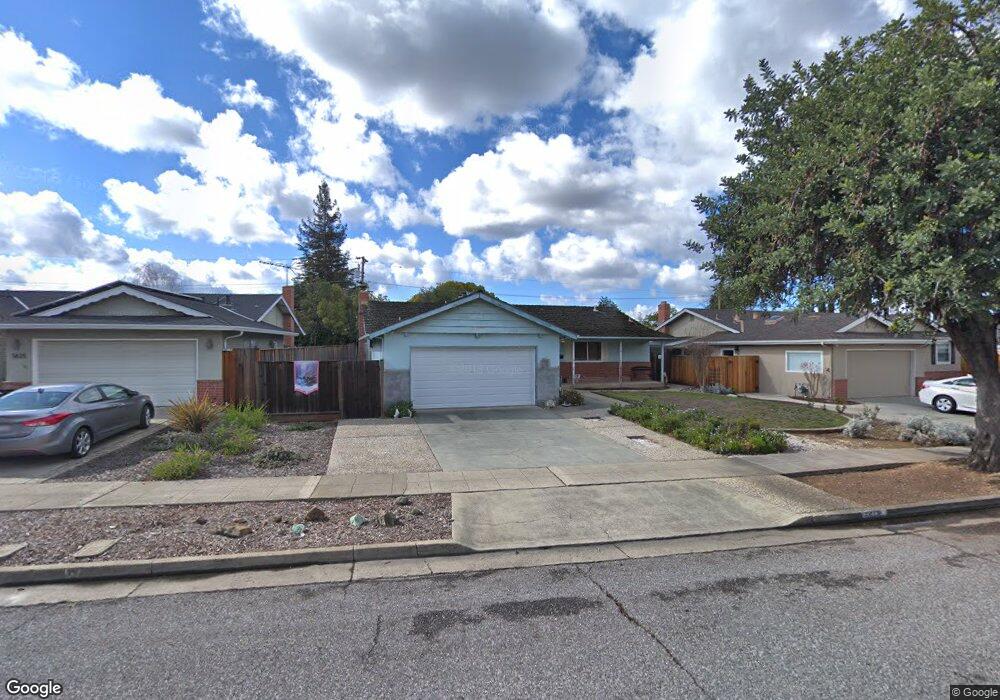
5617 Arbor Dell Way San Jose, CA 95124
Dartmouth NeighborhoodEstimated Value: $1,389,000 - $1,911,000
3
Beds
2
Baths
1,315
Sq Ft
$1,315/Sq Ft
Est. Value
About This Home
This home is located at 5617 Arbor Dell Way, San Jose, CA 95124 and is currently estimated at $1,729,151, approximately $1,314 per square foot. 5617 Arbor Dell Way is a home located in Santa Clara County with nearby schools including Noddin Elementary School, Lietz Elementary School, and Union Middle School.
Ownership History
Date
Name
Owned For
Owner Type
Purchase Details
Closed on
Sep 1, 2010
Sold by
Zuber Yvonne Myrtha
Bought by
Zuber Yvonne Myrtha
Current Estimated Value
Home Financials for this Owner
Home Financials are based on the most recent Mortgage that was taken out on this home.
Original Mortgage
$191,500
Outstanding Balance
$126,710
Interest Rate
4.48%
Mortgage Type
New Conventional
Estimated Equity
$1,602,441
Purchase Details
Closed on
Jan 6, 1998
Sold by
Fontana Charles F and Fontana Marlene J
Bought by
Zuber Yvonne Myrtha
Home Financials for this Owner
Home Financials are based on the most recent Mortgage that was taken out on this home.
Original Mortgage
$227,150
Interest Rate
7.16%
Create a Home Valuation Report for This Property
The Home Valuation Report is an in-depth analysis detailing your home's value as well as a comparison with similar homes in the area
Home Values in the Area
Average Home Value in this Area
Purchase History
| Date | Buyer | Sale Price | Title Company |
|---|---|---|---|
| Zuber Yvonne Myrtha | -- | Chicago Title Company | |
| Zuber Yvonne Myrtha | $285,000 | Old Republic Title Company |
Source: Public Records
Mortgage History
| Date | Status | Borrower | Loan Amount |
|---|---|---|---|
| Open | Zuber Yvonne Myrtha | $191,500 | |
| Closed | Zuber Yvonne Myrtha | $227,150 |
Source: Public Records
Tax History Compared to Growth
Tax History
| Year | Tax Paid | Tax Assessment Tax Assessment Total Assessment is a certain percentage of the fair market value that is determined by local assessors to be the total taxable value of land and additions on the property. | Land | Improvement |
|---|---|---|---|---|
| 2025 | $7,285 | $455,052 | $182,019 | $273,033 |
| 2024 | $7,285 | $446,130 | $178,450 | $267,680 |
| 2023 | $7,113 | $437,383 | $174,951 | $262,432 |
| 2022 | $6,980 | $428,808 | $171,521 | $257,287 |
| 2021 | $6,809 | $420,401 | $168,158 | $252,243 |
| 2020 | $6,640 | $416,091 | $166,434 | $249,657 |
| 2019 | $6,508 | $407,933 | $163,171 | $244,762 |
| 2018 | $6,345 | $399,935 | $159,972 | $239,963 |
| 2017 | $6,258 | $392,094 | $156,836 | $235,258 |
| 2016 | $5,968 | $384,407 | $153,761 | $230,646 |
| 2015 | $5,870 | $378,634 | $151,452 | $227,182 |
| 2014 | $5,375 | $371,218 | $148,486 | $222,732 |
Source: Public Records
Map
Nearby Homes
- 5633 Drysdale Dr
- 1705 Blossom Hill Rd
- 5743 Begonia Dr
- 1563 Dorcey Ln
- 102 Belvale Dr
- 103 Belridge Dr
- 0000 Harwood Rd
- 118 Belridge Dr
- 1467 Nesbit Ct
- 1796 Chevalier Dr
- 5813 Chambertin Dr
- 1464 Athenour Ct
- 1495 Montalban Dr
- 5066 Carter Ave
- 5051 Joseph Ln
- 14510 Blossom Hill Rd
- 1423 Dot Ct
- 1432 Montelegre Dr
- 1599 Rebel Way
- 5121 Noella Way
- 5609 Arbor Dell Way
- 5625 Arbor Dell Way
- 5616 Rudy Dr
- 5608 Rudy Dr
- 5633 Arbor Dell Way
- 5601 Arbor Dell Way
- 5624 Rudy Dr
- 5602 Rudy Dr
- 5616 Arbor Dell Way
- 5624 Arbor Dell Way
- 1623 Flower Garden Ln
- 5608 Arbor Dell Way
- 5634 Rudy Dr
- 5641 Arbor Dell Way
- 5602 Arbor Dell Way
- 1619 Flower Garden Ln
- 1651 Magnolia Blossom Ln
- 1648 Blossom Hill Rd
- 1613 Flower Garden Ln
- 5649 Arbor Dell Way