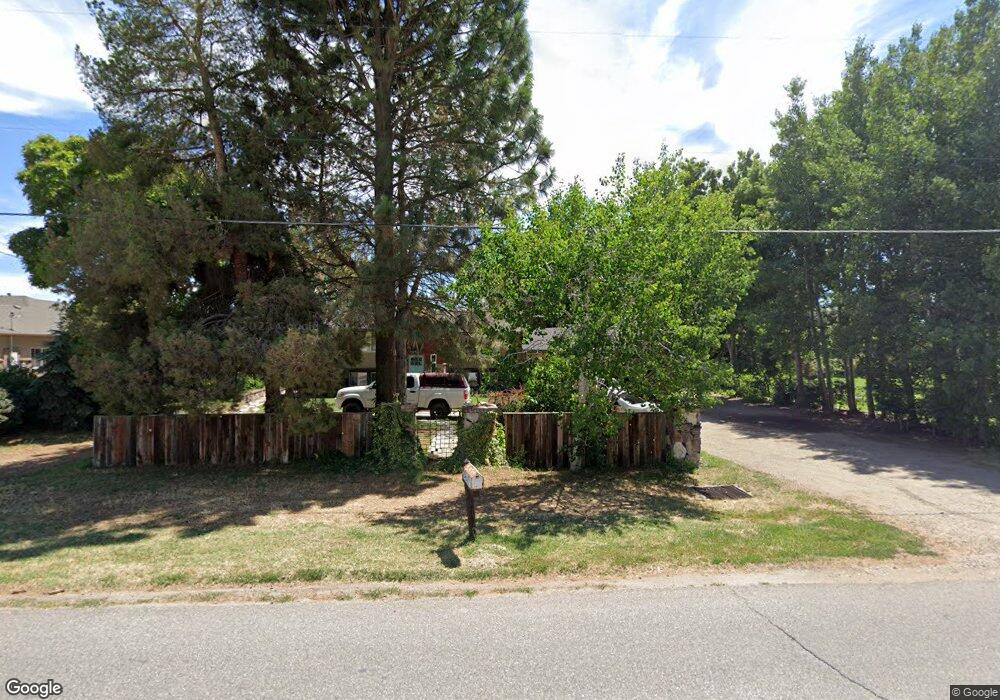
5619 W 5100 S Hooper, UT 84315
Estimated Value: $537,000 - $609,000
4
Beds
1
Bath
1,590
Sq Ft
$363/Sq Ft
Est. Value
About This Home
This home is located at 5619 W 5100 S, Hooper, UT 84315 and is currently estimated at $577,041, approximately $362 per square foot. 5619 W 5100 S is a home located in Weber County with nearby schools including Hooper Elementary School, Rocky Mountain Junior High School, and Fremont High School.
Ownership History
Date
Name
Owned For
Owner Type
Purchase Details
Closed on
Dec 2, 2005
Sold by
Fox John
Bought by
Fox John and Fox Kimberly
Current Estimated Value
Home Financials for this Owner
Home Financials are based on the most recent Mortgage that was taken out on this home.
Original Mortgage
$50,000
Outstanding Balance
$27,725
Interest Rate
6.14%
Mortgage Type
Credit Line Revolving
Estimated Equity
$549,316
Purchase Details
Closed on
Sep 19, 2005
Sold by
Young Ronald A and Young Deanna C
Bought by
Fox John
Purchase Details
Closed on
Apr 15, 2002
Sold by
Young Ronald A and Young Deanna C
Bought by
Young Ronald A and Young Deanna C
Home Financials for this Owner
Home Financials are based on the most recent Mortgage that was taken out on this home.
Original Mortgage
$40,000
Interest Rate
6.87%
Purchase Details
Closed on
Aug 31, 2001
Sold by
Young Ronald A and Young Deanna C
Bought by
Young Ronald A and Young Deanna C
Create a Home Valuation Report for This Property
The Home Valuation Report is an in-depth analysis detailing your home's value as well as a comparison with similar homes in the area
Home Values in the Area
Average Home Value in this Area
Purchase History
| Date | Buyer | Sale Price | Title Company |
|---|---|---|---|
| Fox John | -- | Olympus Title | |
| Fox John | -- | Inwest Title Ogden | |
| Young Ronald A | -- | Backman Stewart Title | |
| Young Ronald A | -- | Backman Stewart Title | |
| Young Ronald A | -- | -- |
Source: Public Records
Mortgage History
| Date | Status | Borrower | Loan Amount |
|---|---|---|---|
| Open | Fox John | $50,000 | |
| Previous Owner | Young Ronald A | $40,000 |
Source: Public Records
Tax History Compared to Growth
Tax History
| Year | Tax Paid | Tax Assessment Tax Assessment Total Assessment is a certain percentage of the fair market value that is determined by local assessors to be the total taxable value of land and additions on the property. | Land | Improvement |
|---|---|---|---|---|
| 2025 | $1,771 | $517,457 | $192,765 | $324,692 |
| 2024 | $2,920 | $285,159 | $111,780 | $173,379 |
| 2023 | $1,367 | $286,300 | $131,748 | $154,552 |
| 2022 | $1,105 | $294,800 | $103,402 | $191,398 |
| 2021 | $2,453 | $404,000 | $116,468 | $287,532 |
| 2020 | $2,265 | $341,000 | $96,408 | $244,592 |
| 2019 | $2,299 | $327,000 | $69,400 | $257,600 |
| 2018 | $2,092 | $284,000 | $69,400 | $214,600 |
| 2017 | $1,725 | $227,000 | $67,800 | $159,200 |
| 2016 | $1,531 | $110,680 | $29,598 | $81,082 |
| 2015 | $1,500 | $106,819 | $29,598 | $77,221 |
| 2014 | $1,468 | $101,688 | $33,950 | $67,738 |
Source: Public Records
Map
Nearby Homes
- 3729 S 5600 W Unit 6
- 3720 S 5600 W Unit 2
- 3719 S 5600 W Unit 7
- 6014 W 5300 S
- 5947 W 4600 S
- 0 W 5500 S
- 5335 W 5500 S
- 3632 S 5400 W
- 4879 S 5050 W
- 6036 W 4700 S
- 4146 S 5800 W Unit 5
- 4163 S 5800 W Unit 2
- 3191 S 5100 St W Unit 1
- 4931 S 4700 W
- 4700 W 5500 S
- 4111 S 5350 W
- 4909 W 5850 S
- 4556 W 4950 S
- 4632 W 5750 S
- 4126 S 4950 W