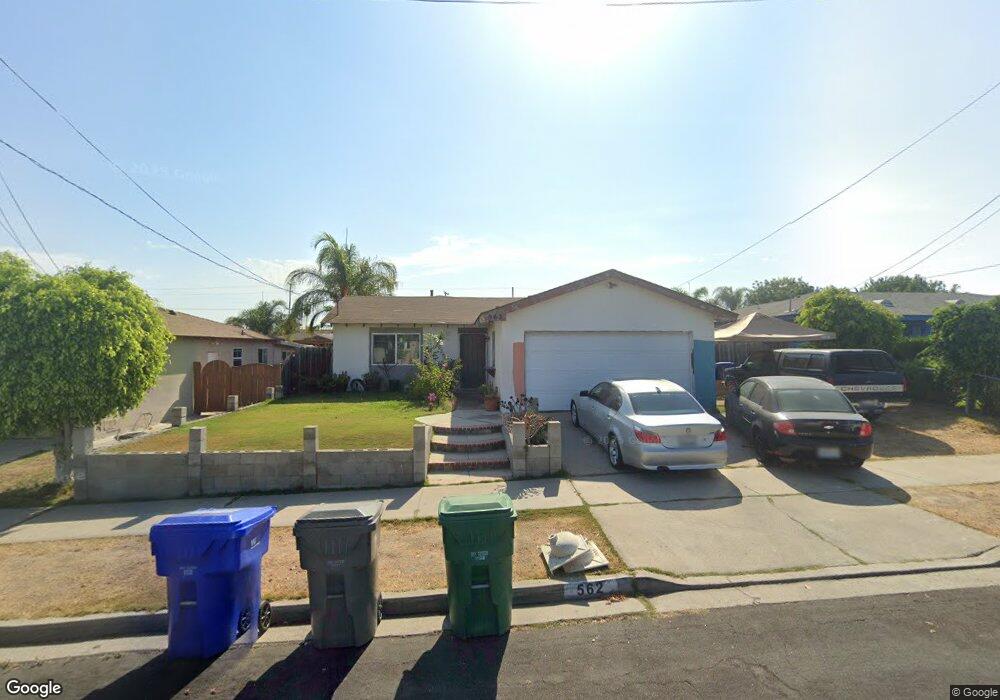
562 Gold Dr Oceanside, CA 92057
North Valley NeighborhoodEstimated Value: $663,000 - $737,000
3
Beds
2
Baths
1,117
Sq Ft
$636/Sq Ft
Est. Value
About This Home
This home is located at 562 Gold Dr, Oceanside, CA 92057 and is currently estimated at $710,381, approximately $635 per square foot. 562 Gold Dr is a home located in San Diego County with nearby schools including Libby Elementary School, Cesar Chavez Middle School, and El Camino High School.
Ownership History
Date
Name
Owned For
Owner Type
Purchase Details
Closed on
Mar 7, 2005
Sold by
Raslan Sylvia Marie and Perez Linda Esperanza
Bought by
Perez Linda E
Current Estimated Value
Home Financials for this Owner
Home Financials are based on the most recent Mortgage that was taken out on this home.
Original Mortgage
$281,000
Interest Rate
5.1%
Mortgage Type
Negative Amortization
Create a Home Valuation Report for This Property
The Home Valuation Report is an in-depth analysis detailing your home's value as well as a comparison with similar homes in the area
Home Values in the Area
Average Home Value in this Area
Purchase History
| Date | Buyer | Sale Price | Title Company |
|---|---|---|---|
| Perez Linda E | $243,000 | Southland Title Company |
Source: Public Records
Mortgage History
| Date | Status | Borrower | Loan Amount |
|---|---|---|---|
| Previous Owner | Perez Linda E | $281,000 |
Source: Public Records
Tax History
| Year | Tax Paid | Tax Assessment Tax Assessment Total Assessment is a certain percentage of the fair market value that is determined by local assessors to be the total taxable value of land and additions on the property. | Land | Improvement |
|---|---|---|---|---|
| 2025 | $4,979 | $456,683 | $327,496 | $129,187 |
| 2024 | $4,979 | $447,729 | $321,075 | $126,654 |
| 2023 | $4,824 | $438,951 | $314,780 | $124,171 |
| 2022 | $4,750 | $430,345 | $308,608 | $121,737 |
| 2021 | $4,767 | $421,907 | $302,557 | $119,350 |
| 2020 | $4,619 | $417,582 | $299,455 | $118,127 |
| 2019 | $4,381 | $400,000 | $232,000 | $168,000 |
| 2018 | $4,086 | $370,000 | $215,000 | $155,000 |
| 2017 | $3,757 | $340,000 | $198,000 | $142,000 |
| 2016 | $3,267 | $300,000 | $175,000 | $125,000 |
| 2015 | $2,949 | $275,000 | $161,000 | $114,000 |
| 2014 | $2,626 | $250,000 | $147,000 | $103,000 |
Source: Public Records
Map
Nearby Homes
- 5015 Macario Dr
- 530 Roja Dr
- 150 N River Cir Unit 105
- 5074 Cascade Way Unit 102
- 663 Charles Dr
- 5120 N River Rd Unit E
- 648 Flora Dr
- 4924 Verde Dr
- 656 Parker St
- 662 Michael St
- 436 W Redondo Dr
- 4918 Roja Dr
- 671 Parker St
- 4745 Marblehead Bay Dr
- 868 Panella Ct
- 361 Point Windemere Place
- 4851 Cardiff Bay Dr
- 166 Mckinley St
- 354 Lustrosos St
- 517 Calle Montecito Unit 91
Your Personal Tour Guide
Ask me questions while you tour the home.