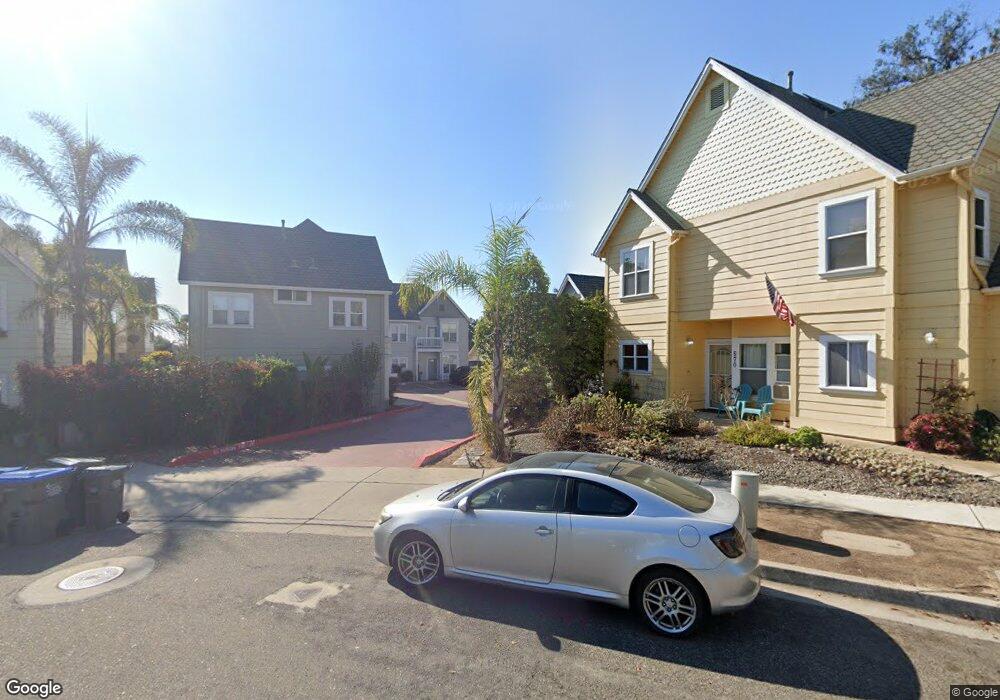
562 Margie Place Nipomo, CA 93444
Estimated Value: $436,000 - $498,000
2
Beds
2
Baths
863
Sq Ft
$545/Sq Ft
Est. Value
About This Home
This home is located at 562 Margie Place, Nipomo, CA 93444 and is currently estimated at $470,310, approximately $544 per square foot. 562 Margie Place is a home located in San Luis Obispo County with nearby schools including Dorothea Lange Elementary School, Mesa Middle School, and Nipomo High School.
Ownership History
Date
Name
Owned For
Owner Type
Purchase Details
Closed on
Jul 9, 2010
Sold by
Smith S Eugene and Smith Sandra E
Bought by
Smith S Eugene and Smith Sandra E
Current Estimated Value
Purchase Details
Closed on
Jul 2, 2010
Sold by
Castro Dana Lynne and Elrod Dana Lynne
Bought by
Smith S Eugene and Smith Sandra E
Purchase Details
Closed on
Mar 16, 2006
Sold by
Aittama Amy and Ward Laura
Bought by
Elrod Dana Lynne
Home Financials for this Owner
Home Financials are based on the most recent Mortgage that was taken out on this home.
Original Mortgage
$28,600
Interest Rate
6.35%
Mortgage Type
Credit Line Revolving
Purchase Details
Closed on
Feb 10, 2004
Sold by
Nipomo Village Llc
Bought by
Aittama Amy and Ward Laura
Home Financials for this Owner
Home Financials are based on the most recent Mortgage that was taken out on this home.
Original Mortgage
$180,000
Interest Rate
5.69%
Mortgage Type
Purchase Money Mortgage
Create a Home Valuation Report for This Property
The Home Valuation Report is an in-depth analysis detailing your home's value as well as a comparison with similar homes in the area
Home Values in the Area
Average Home Value in this Area
Purchase History
| Date | Buyer | Sale Price | Title Company |
|---|---|---|---|
| Smith S Eugene | -- | Fidelity National Title Co | |
| Castro Dana Lynne | -- | Fidelity National Title Co | |
| Smith S Eugene | $152,000 | Fidelity National Title Co | |
| Elrod Dana Lynne | $343,000 | First American Title Co | |
| Aittama Amy | $180,000 | Fidelity Title Company |
Source: Public Records
Mortgage History
| Date | Status | Borrower | Loan Amount |
|---|---|---|---|
| Previous Owner | Elrod Dana Lynne | $28,600 | |
| Previous Owner | Elrod Dana Lynne | $274,400 | |
| Previous Owner | Aittama Amy | $180,000 |
Source: Public Records
Tax History Compared to Growth
Tax History
| Year | Tax Paid | Tax Assessment Tax Assessment Total Assessment is a certain percentage of the fair market value that is determined by local assessors to be the total taxable value of land and additions on the property. | Land | Improvement |
|---|---|---|---|---|
| 2025 | $2,003 | $194,725 | $102,487 | $92,238 |
| 2024 | $1,980 | $190,908 | $100,478 | $90,430 |
| 2023 | $1,980 | $187,165 | $98,508 | $88,657 |
| 2022 | $1,950 | $183,496 | $96,577 | $86,919 |
| 2021 | $1,947 | $179,899 | $94,684 | $85,215 |
| 2020 | $1,924 | $178,056 | $93,714 | $84,342 |
| 2019 | $1,913 | $174,566 | $91,877 | $82,689 |
| 2018 | $1,890 | $171,144 | $90,076 | $81,068 |
| 2017 | $1,854 | $167,789 | $88,310 | $79,479 |
| 2016 | $1,749 | $164,500 | $86,579 | $77,921 |
| 2015 | $1,724 | $162,030 | $85,279 | $76,751 |
| 2014 | $1,660 | $158,857 | $83,609 | $75,248 |
Source: Public Records
Map
Nearby Homes
- 626 Juno Ct
- 450 Avenida de Socios Unit 12
- 424 Bermuda Place
- 368 Avenida de Amigos
- 525 Grande Ave Unit D
- 725 Monarch Ln
- 483 Violet Ave
- 232 Scarlett Cir
- 522 Higos Way
- Mesa Plan at Hill Street Terraces - Hill Street Series
- Pacific Plan at Hill Street Terraces - Hill Street Series
- Monarch Plan at Hill Street Terraces - Hill Street Series
- Rancho Plan at Hill Street Terraces - Hill Street Series
- Dana Plan at Hill Street Terraces - Hill Street Series
- 840 Story St
- 449 W Tefft St Unit 23
- 449 W Tefft St Unit 13
- 680 Hill St
- 90111003 W Price St
- 719 W Tefft St
- 560 Margie Place
- 558 Margie Place
- 566 Margie Place
- 522 Martita Plaza Unit 520- LOFT - B
- 522 Martita Plaza Unit B
- 522 Martita Plaza Unit 520 MARTITA PL
- 522 Martita Plaza
- 522 Martita Place
- 554 Margie Place
- 556 Margie Place
- 552 Margie Place
- 570 Margie Place
- 550 Margie Place
- 568 Margie Place
- 544 Margie Place
- 546 Margie Place
- 518 Martita Place
- 574 Adina Way
- 576 Adina Way