Estimated Value: $88,000 - $120,000
2
Beds
1
Bath
1,024
Sq Ft
$105/Sq Ft
Est. Value
About This Home
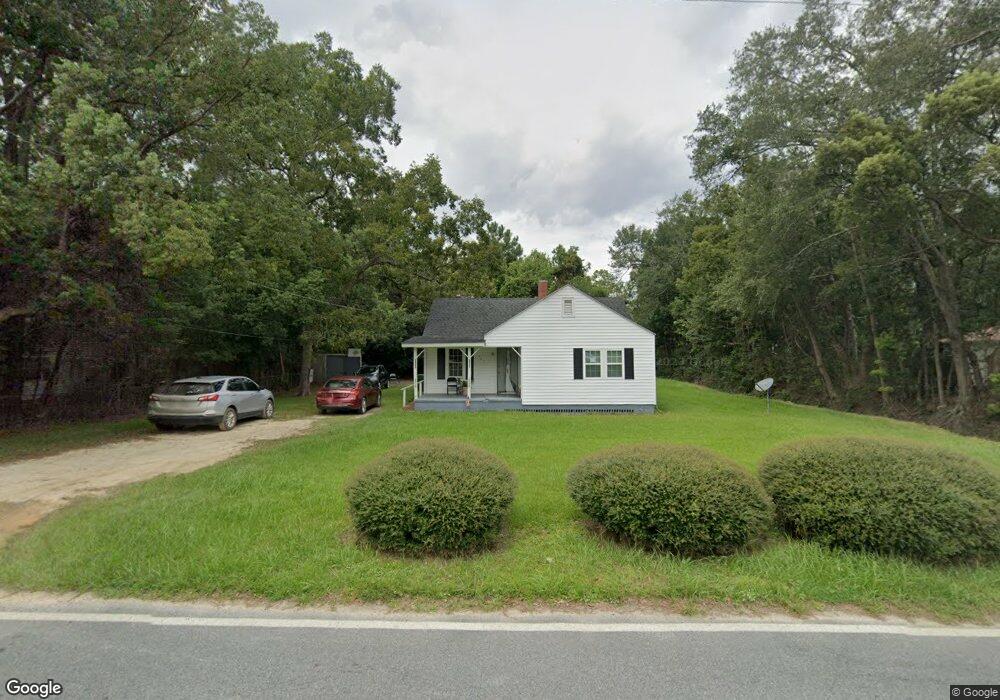
This home is located at 562 S Macon St, Jesup, GA 31545 and is currently estimated at $107,854, approximately $105 per square foot. 562 S Macon St is a home located in Wayne County with nearby schools including Martha Rawls Smith Elementary School, Arthur Williams Middle School, and Wayne County High School.
Ownership History
Date
Name
Owned For
Owner Type
Purchase Details
Closed on
Jun 23, 2025
Sold by
Behrens Suzan D
Bought by
Chabrecek Ryan M
Current Estimated Value
Purchase Details
Closed on
Dec 22, 2017
Sold by
Martin Charles S
Bought by
Chabrecek Ryan M and Holzworth Robert C
Home Financials for this Owner
Home Financials are based on the most recent Mortgage that was taken out on this home.
Original Mortgage
$24,400
Interest Rate
3.92%
Mortgage Type
New Conventional
Purchase Details
Closed on
Oct 30, 2012
Sold by
Martin Charles S
Bought by
Martin Charles S
Purchase Details
Closed on
Oct 26, 2012
Sold by
Martin Charles S
Bought by
Martin Charles S
Purchase Details
Closed on
Nov 1, 2002
Sold by
Shelton Bobbie
Bought by
Martin Merle H
Purchase Details
Closed on
Mar 1, 2001
Purchase Details
Closed on
Dec 1, 2000
Purchase Details
Closed on
May 1, 1990
Purchase Details
Closed on
Mar 1, 1985
Create a Home Valuation Report for This Property
The Home Valuation Report is an in-depth analysis detailing your home's value as well as a comparison with similar homes in the area
Home Values in the Area
Average Home Value in this Area
Purchase History
| Date | Buyer | Sale Price | Title Company |
|---|---|---|---|
| Chabrecek Ryan M | -- | -- | |
| Chabrecek Ryan M | $30,500 | -- | |
| Martin Charles S | -- | -- | |
| Martin Charles S | -- | -- | |
| Martin Merle H | $18,000 | -- | |
| -- | -- | -- | |
| Shelton Bobbie | -- | -- | |
| -- | $26,500 | -- | |
| -- | $24,000 | -- | |
| -- | $18,000 | -- | |
| -- | $15,500 | -- |
Source: Public Records
Mortgage History
| Date | Status | Borrower | Loan Amount |
|---|---|---|---|
| Previous Owner | Chabrecek Ryan M | $24,400 |
Source: Public Records
Tax History Compared to Growth
Tax History
| Year | Tax Paid | Tax Assessment Tax Assessment Total Assessment is a certain percentage of the fair market value that is determined by local assessors to be the total taxable value of land and additions on the property. | Land | Improvement |
|---|---|---|---|---|
| 2024 | $733 | $23,960 | $4,867 | $19,093 |
| 2023 | $530 | $14,979 | $4,560 | $10,419 |
| 2022 | $472 | $14,979 | $4,560 | $10,419 |
| 2021 | $505 | $14,979 | $4,560 | $10,419 |
| 2020 | $523 | $14,979 | $4,560 | $10,419 |
| 2019 | $538 | $14,979 | $4,560 | $10,419 |
| 2018 | $438 | $14,979 | $4,560 | $10,419 |
| 2017 | $448 | $14,979 | $4,560 | $10,419 |
| 2016 | $448 | $14,979 | $4,560 | $10,419 |
| 2014 | $449 | $14,979 | $4,560 | $10,419 |
| 2013 | -- | $14,979 | $4,560 | $10,419 |
Source: Public Records
Map
Nearby Homes
- 560 S Macon St
- 806 S Macon St
- 380 S 2nd St
- 387 S 2nd St
- 641 S 4th St
- 412 W Orange St
- 686 S 4th St
- 0 Fourth S
- 136 Groveland St
- 757 Old Screven Rd
- 143 Groveland St
- 00 84 Hwy
- 9474 Us Hwy 301
- 106 Mangrove Ct
- 113 Mangrove Ct
- 412 E Orange St
- 195 Hollywood Ave Unit 3
- 479 Brannen St
- 705 S Elm St
- 0 Peachtree Dr