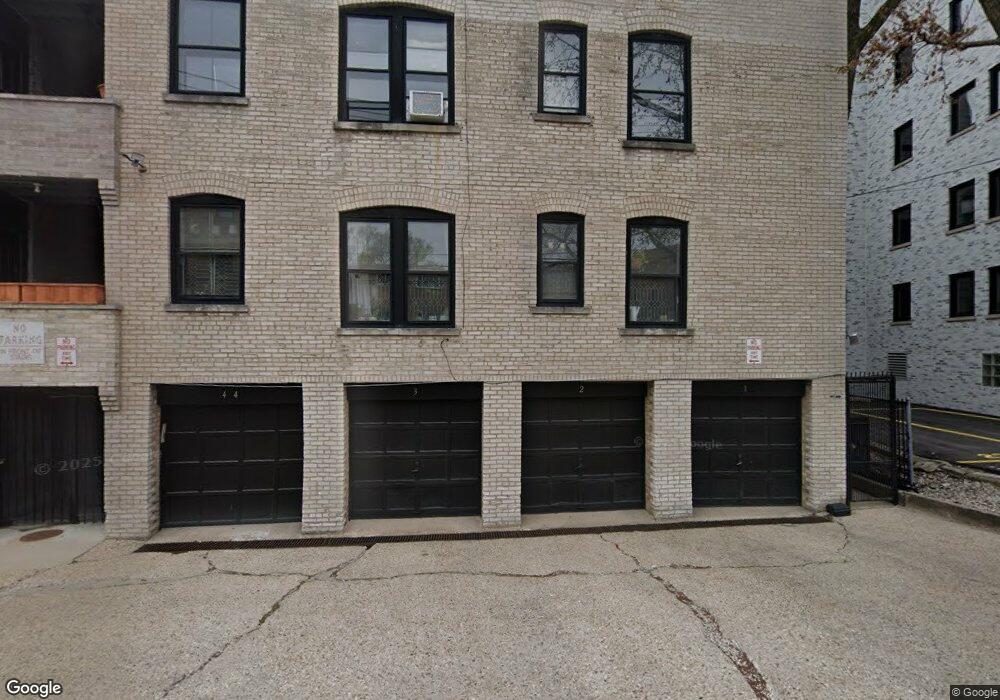
562 Sheridan Square Unit 5621 Evanston, IL 60202
Southeast Evanston NeighborhoodEstimated Value: $289,000 - $366,000
2
Beds
--
Bath
1,000
Sq Ft
$334/Sq Ft
Est. Value
About This Home
This home is located at 562 Sheridan Square Unit 5621, Evanston, IL 60202 and is currently estimated at $333,860, approximately $333 per square foot. 562 Sheridan Square Unit 5621 is a home located in Cook County with nearby schools including Lincoln Elementary School, Washington Elementary School, and Nichols Middle School.
Ownership History
Date
Name
Owned For
Owner Type
Purchase Details
Closed on
May 8, 2023
Sold by
Melinda F Kwedar Declaration Of Trust
Bought by
Downs David and Krupinski Lydia
Current Estimated Value
Home Financials for this Owner
Home Financials are based on the most recent Mortgage that was taken out on this home.
Original Mortgage
$237,500
Outstanding Balance
$231,586
Interest Rate
6.99%
Mortgage Type
New Conventional
Estimated Equity
$102,274
Purchase Details
Closed on
May 17, 2017
Sold by
Kwedar Melinda F
Bought by
Kwedar Melinda F and Melinda F Kwedar Declaration Of Trust
Purchase Details
Closed on
Jul 8, 1994
Sold by
Kelly Margaret C
Bought by
Kwedar Melinda F
Home Financials for this Owner
Home Financials are based on the most recent Mortgage that was taken out on this home.
Original Mortgage
$106,600
Interest Rate
5.62%
Create a Home Valuation Report for This Property
The Home Valuation Report is an in-depth analysis detailing your home's value as well as a comparison with similar homes in the area
Home Values in the Area
Average Home Value in this Area
Purchase History
| Date | Buyer | Sale Price | Title Company |
|---|---|---|---|
| Downs David | $250,000 | Proper Title | |
| Kwedar Melinda F | -- | None Available | |
| Kwedar Melinda F | $164,000 | -- |
Source: Public Records
Mortgage History
| Date | Status | Borrower | Loan Amount |
|---|---|---|---|
| Open | Downs David | $237,500 | |
| Previous Owner | Kwedar Melinda F | $106,600 |
Source: Public Records
Tax History Compared to Growth
Tax History
| Year | Tax Paid | Tax Assessment Tax Assessment Total Assessment is a certain percentage of the fair market value that is determined by local assessors to be the total taxable value of land and additions on the property. | Land | Improvement |
|---|---|---|---|---|
| 2024 | $5,664 | $23,399 | $2,328 | $21,071 |
| 2023 | $5,435 | $23,399 | $2,328 | $21,071 |
| 2022 | $5,435 | $23,399 | $2,328 | $21,071 |
| 2021 | $5,375 | $20,255 | $1,241 | $19,014 |
| 2020 | $5,304 | $20,255 | $1,241 | $19,014 |
| 2019 | $5,140 | $21,937 | $1,241 | $20,696 |
| 2018 | $5,373 | $19,610 | $1,047 | $18,563 |
| 2017 | $3,611 | $19,610 | $1,047 | $18,563 |
| 2016 | $4,331 | $19,610 | $1,047 | $18,563 |
| 2015 | $4,528 | $19,509 | $872 | $18,637 |
| 2014 | $5,140 | $21,921 | $872 | $21,049 |
| 2013 | $5,006 | $21,921 | $872 | $21,049 |
Source: Public Records
Map
Nearby Homes
- 594 Sheridan Square Unit 3
- 628 Sheridan Square Unit 2
- 616 Michigan Ave Unit G
- 711 Michigan Ave
- 608 Hinman Ave Unit 4S
- 319 Kedzie St Unit 3E
- 321 Kedzie St Unit GND
- 1628 W Juneway Terrace Unit 2W
- 1628 W Juneway Terrace Unit 1
- 840 Michigan Ave Unit 10
- 7756 N Sheridan Rd Unit 16
- 835 Judson Ave Unit 305
- 7730 N Paulina St Unit 1
- 7708 N Ashland Ave
- 847 Judson Ave Unit 2
- 606B South Blvd
- 601 Linden Place Unit 116
- 428 Callan Ave
- 645 Custer Ave Unit 103
- 7637 N Bosworth Ave Unit 2N
- 562 Sheridan Square Unit 5623
- 562 Sheridan Square Unit 5622
- 562 Sheridan Square Unit 1
- 562 Sheridan Square Unit 3
- 560 Sheridan Square Unit 1
- 560 Sheridan Square Unit 5602
- 560 Sheridan Square Unit 5601
- 560 Sheridan Square Unit 5603
- 560 Sheridan Square Unit 3
- 560 Sheridan Square Unit 2
- 570 Sheridan Square Unit 3
- 570 Sheridan Square Unit 5701
- 570 Sheridan Square Unit 5703
- 570 Sheridan Square Unit 5702
- 570 Sheridan Square Unit 2
- 570 Sheridan Square Unit 1
- 572 Sheridan Square Unit 5723
- 572 Sheridan Square Unit 5721
- 572 Sheridan Square Unit 5722
- 572 Sheridan Square Unit 2