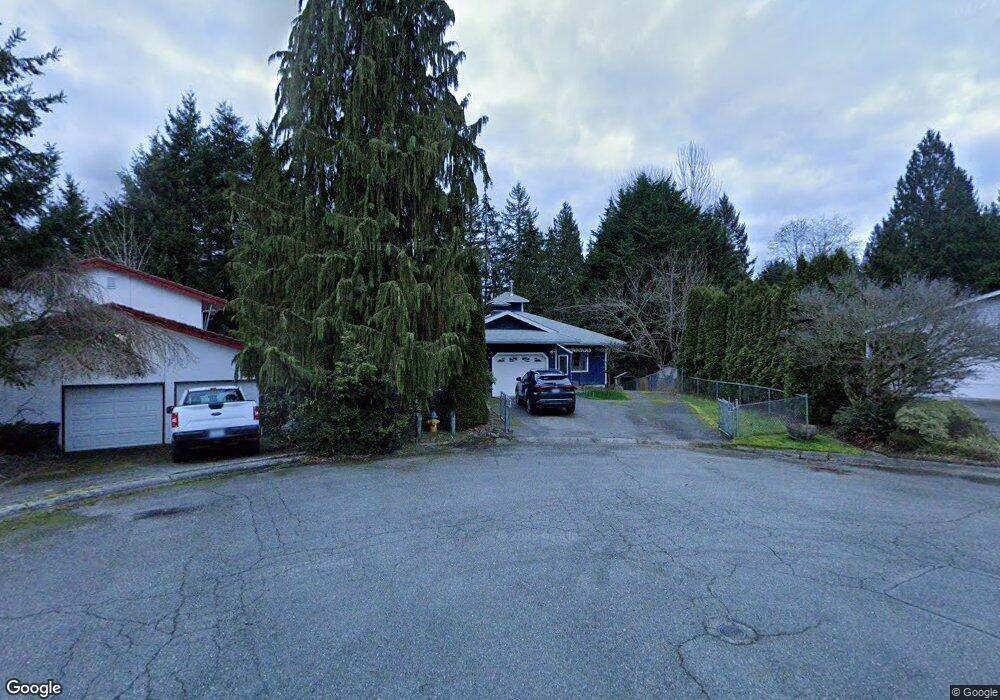
5621 126th St SE Unit B Snohomish, WA 98296
Estimated Value: $839,000 - $876,508
1
Bed
1
Bath
1,190
Sq Ft
$722/Sq Ft
Est. Value
About This Home
This home is located at 5621 126th St SE Unit B, Snohomish, WA 98296 and is currently estimated at $859,377, approximately $722 per square foot. 5621 126th St SE Unit B is a home located in Snohomish County with nearby schools including Little Cedars Elementary School, Valley View Middle School, and Glacier Peak High School.
Ownership History
Date
Name
Owned For
Owner Type
Purchase Details
Closed on
Feb 22, 2023
Sold by
Angerman Rachel
Bought by
5621 126Th Se Llc
Current Estimated Value
Purchase Details
Closed on
Apr 7, 2021
Sold by
Cison Karen Ann and Olson Jerald
Bought by
Angerman Rachel
Home Financials for this Owner
Home Financials are based on the most recent Mortgage that was taken out on this home.
Original Mortgage
$671,804
Interest Rate
3%
Mortgage Type
FHA
Purchase Details
Closed on
Sep 9, 2015
Sold by
Karen Ann
Bought by
Olson Paige
Home Financials for this Owner
Home Financials are based on the most recent Mortgage that was taken out on this home.
Original Mortgage
$300,000
Interest Rate
3.86%
Mortgage Type
New Conventional
Purchase Details
Closed on
Apr 1, 2013
Sold by
Olson Karen Ann and Estate Of Richard A Williams
Bought by
Olson Karen Ann
Purchase Details
Closed on
Nov 29, 2004
Sold by
Williams Ann H
Bought by
Williams Richard A
Create a Home Valuation Report for This Property
The Home Valuation Report is an in-depth analysis detailing your home's value as well as a comparison with similar homes in the area
Home Values in the Area
Average Home Value in this Area
Purchase History
| Date | Buyer | Sale Price | Title Company |
|---|---|---|---|
| 5621 126Th Se Llc | -- | -- | |
| Angerman Rachel | $695,000 | Chicago Title Company Of Wa | |
| Olson Paige | $195,500 | Wfg Natl Title | |
| Olson Karen Ann | -- | None Available | |
| Olson Karen Ann | -- | None Available | |
| Williams Richard A | -- | -- |
Source: Public Records
Mortgage History
| Date | Status | Borrower | Loan Amount |
|---|---|---|---|
| Previous Owner | Angerman Rachel | $671,804 | |
| Previous Owner | Olson Paige | $300,000 |
Source: Public Records
Tax History Compared to Growth
Tax History
| Year | Tax Paid | Tax Assessment Tax Assessment Total Assessment is a certain percentage of the fair market value that is determined by local assessors to be the total taxable value of land and additions on the property. | Land | Improvement |
|---|---|---|---|---|
| 2025 | $6,988 | $783,200 | $455,000 | $328,200 |
| 2024 | $6,988 | $727,200 | $410,000 | $317,200 |
| 2023 | $7,755 | $878,200 | $515,000 | $363,200 |
| 2022 | $6,441 | $588,000 | $302,000 | $286,000 |
| 2020 | $5,968 | $495,300 | $245,000 | $250,300 |
| 2019 | $5,457 | $444,300 | $212,000 | $232,300 |
| 2018 | $5,885 | $403,100 | $195,000 | $208,100 |
| 2017 | $5,102 | $355,500 | $160,000 | $195,500 |
| 2016 | $4,766 | $319,900 | $136,000 | $183,900 |
| 2015 | $4,565 | $294,500 | $125,000 | $169,500 |
| 2013 | $3,855 | $238,300 | $103,000 | $135,300 |
Source: Public Records
Map
Nearby Homes
- 12603 57th Dr SE
- 12325 55th Dr SE
- 12313 55th Dr SE
- 12213 53rd Ave SE
- 12125 53rd Ave SE
- 5916 121st St SE
- 12611 50th Dr SE
- 5923 121st St SE
- 5010 123rd St SE
- 5729 119th St SE
- 6516 128th Place SE
- 12414 51st Ave SE
- 11910 61st Ave SE
- 11903 Seattle Hill Rd Unit A
- 13402 60th Dr SE
- 5023 119th Place SE
- 5022 117th St SE
- 12909 67th Ave SE
- 11525 52nd Ave SE
- 13807 Silver Firs Dr
- 5621 126th St SE Unit 5621 126th SE, A
- 5621 126th St SE
- 5621 126th St SE
- 5621 126th St SE Unit A
- 5617 126th St SE
- 5610 126th St SE
- 12624 57th Dr SE
- 5628 125th St SE
- 5702 125th St SE
- 5710 125th St SE
- 5606 126th St SE
- 12630 57th Dr SE
- 5611 126th St SE
- 5612 125th St SE
- 12610 57th Dr SE
- 5605 126th St SE
- 12604 57th Dr SE
- 5604 126th St SE
- 12702 57th Dr SE
- 12618 57th Dr SE