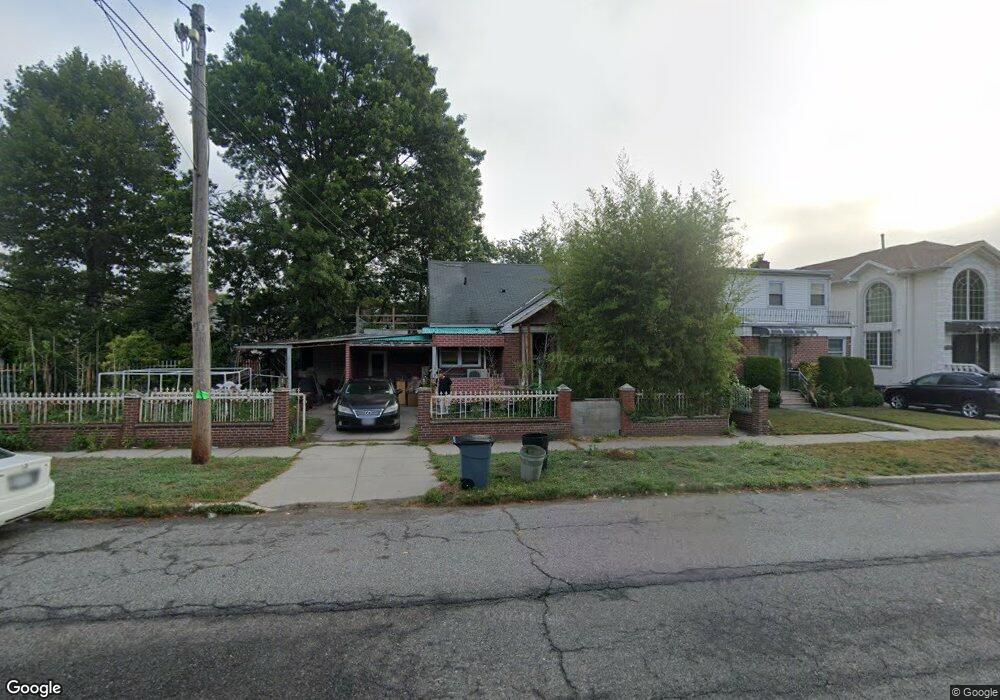
5621 Hollis Court Blvd Fresh Meadows, NY 11365
Auburndale NeighborhoodEstimated Value: $1,038,706 - $1,473,000
--
Bed
--
Bath
1,485
Sq Ft
$868/Sq Ft
Est. Value
About This Home
This home is located at 5621 Hollis Court Blvd, Fresh Meadows, NY 11365 and is currently estimated at $1,289,177, approximately $868 per square foot. 5621 Hollis Court Blvd is a home located in Queens County with nearby schools including P.S. 162 The John Golden School, Nathaniel Hawthorne Middle School 74, and Francis Lewis High School.
Ownership History
Date
Name
Owned For
Owner Type
Purchase Details
Closed on
Aug 22, 2018
Sold by
He Sheng Cai and Ho Zeming
Bought by
Ho William Weilin
Current Estimated Value
Purchase Details
Closed on
Jul 30, 2003
Sold by
Bala Santokh
Bought by
He Sheng Cai
Home Financials for this Owner
Home Financials are based on the most recent Mortgage that was taken out on this home.
Original Mortgage
$460,800
Interest Rate
6.31%
Mortgage Type
Purchase Money Mortgage
Purchase Details
Closed on
May 22, 2000
Sold by
Choudry Fazal
Bought by
Bala Santokh
Home Financials for this Owner
Home Financials are based on the most recent Mortgage that was taken out on this home.
Original Mortgage
$315,000
Interest Rate
8.14%
Purchase Details
Closed on
Aug 12, 1996
Sold by
Langstein David A and Langstein Ruth S
Bought by
Choudry Fazal
Home Financials for this Owner
Home Financials are based on the most recent Mortgage that was taken out on this home.
Original Mortgage
$198,750
Interest Rate
7.83%
Create a Home Valuation Report for This Property
The Home Valuation Report is an in-depth analysis detailing your home's value as well as a comparison with similar homes in the area
Home Values in the Area
Average Home Value in this Area
Purchase History
| Date | Buyer | Sale Price | Title Company |
|---|---|---|---|
| Ho William Weilin | -- | -- | |
| He Sheng Cai | $576,000 | -- | |
| Bala Santokh | $350,000 | Commonwealth Land Title Ins | |
| Choudry Fazal | $265,000 | Lawyers Title Insurance Corp |
Source: Public Records
Mortgage History
| Date | Status | Borrower | Loan Amount |
|---|---|---|---|
| Previous Owner | He Sheng Cai | $460,800 | |
| Previous Owner | Bala Santokh | $315,000 | |
| Previous Owner | Choudry Fazal | $198,750 |
Source: Public Records
Tax History Compared to Growth
Tax History
| Year | Tax Paid | Tax Assessment Tax Assessment Total Assessment is a certain percentage of the fair market value that is determined by local assessors to be the total taxable value of land and additions on the property. | Land | Improvement |
|---|---|---|---|---|
| 2025 | $10,556 | $54,942 | $13,545 | $41,397 |
| 2024 | $10,556 | $52,558 | $14,239 | $38,319 |
| 2023 | $9,959 | $49,584 | $12,858 | $36,726 |
| 2022 | $7,004 | $59,280 | $17,100 | $42,180 |
| 2021 | $9,845 | $57,840 | $17,100 | $40,740 |
| 2020 | $9,691 | $57,060 | $17,100 | $39,960 |
| 2019 | $9,162 | $58,980 | $17,100 | $41,880 |
| 2018 | $8,423 | $41,320 | $11,968 | $29,352 |
| 2017 | $7,947 | $38,983 | $13,434 | $25,549 |
| 2016 | $7,793 | $38,983 | $13,434 | $25,549 |
| 2015 | $4,436 | $38,154 | $14,932 | $23,222 |
| 2014 | $4,436 | $36,499 | $15,204 | $21,295 |
Source: Public Records
Map
Nearby Homes
- 198-01 56th Ave
- 53-40 198th St
- 5640 Francis Lewis Blvd
- 197-20 58th Ave
- 53-12 199th St
- 56-39 Francis Lewis Blvd
- 5802 201st St
- 58-39 196th Place
- 50-15 199th St
- 4843 201st St
- 58-23 192nd St
- 58-33 192nd St
- 50-43 192nd St
- 48-18 202nd St
- 58-15 Clearview Expy
- 47-65 196th St
- 47-69 195th St
- 5840 206th St
- 47-52 196th St
- 47-24 197th St
- 5625 Hollis Court Blvd
- 19716 56th Ave
- 19722 56th Ave
- 5629 Hollis Court Blvd
- 19722 56th Ave
- 19722 56th Ave
- 19710 56th Ave
- 19804 56th Ave
- 5633 Hollis Court Blvd
- 56-33 Hollis Court Blvd
- 5603 197th St
- 19808 56th Ave
- 56-37 Hollis Court Blvd
- 5637 Hollis Court Blvd
- 56-14 197th St
- 5604 Hollis Court Blvd
- 19810 56th Ave
- 56-08 197th St Unit 2
- 5612 199th St
- 5634 Hollis Court Blvd