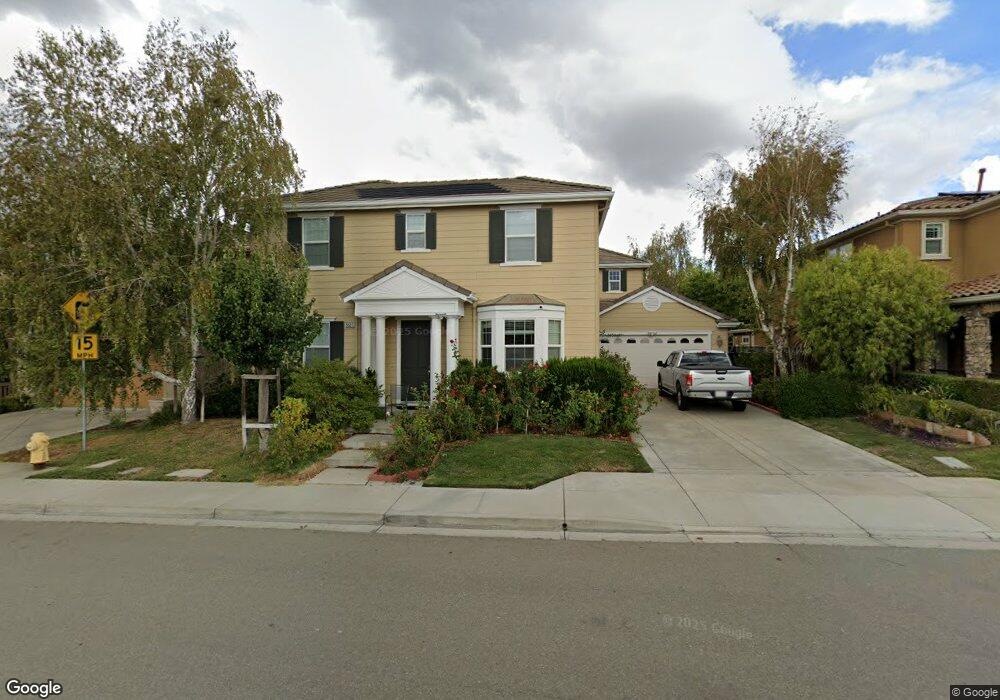
5621 Lysander Way San Ramon, CA 94582
Gale Ranch-Windemere NeighborhoodEstimated Value: $2,024,000 - $2,370,426
4
Beds
3
Baths
3,364
Sq Ft
$661/Sq Ft
Est. Value
About This Home
This home is located at 5621 Lysander Way, San Ramon, CA 94582 and is currently estimated at $2,222,107, approximately $660 per square foot. 5621 Lysander Way is a home located in Contra Costa County with nearby schools including Live Oak Elementary School, Windemere Ranch Middle School, and Dougherty Valley High School.
Ownership History
Date
Name
Owned For
Owner Type
Purchase Details
Closed on
Sep 27, 2018
Sold by
Shanmunganandan Aravindakumar and Aravindakumar Gayatri
Bought by
Yu Hui
Current Estimated Value
Home Financials for this Owner
Home Financials are based on the most recent Mortgage that was taken out on this home.
Original Mortgage
$1,048,000
Outstanding Balance
$913,918
Interest Rate
4.5%
Mortgage Type
New Conventional
Estimated Equity
$1,308,189
Purchase Details
Closed on
Nov 14, 2008
Sold by
Centex Homes
Bought by
Shanmuganandan Aravindakumar and Aravindakumar Gayatri
Home Financials for this Owner
Home Financials are based on the most recent Mortgage that was taken out on this home.
Original Mortgage
$708,900
Interest Rate
6.07%
Mortgage Type
Purchase Money Mortgage
Create a Home Valuation Report for This Property
The Home Valuation Report is an in-depth analysis detailing your home's value as well as a comparison with similar homes in the area
Home Values in the Area
Average Home Value in this Area
Purchase History
| Date | Buyer | Sale Price | Title Company |
|---|---|---|---|
| Yu Hui | $1,310,000 | Chicago Title Company | |
| Shanmuganandan Aravindakumar | $886,500 | First American Title Company |
Source: Public Records
Mortgage History
| Date | Status | Borrower | Loan Amount |
|---|---|---|---|
| Open | Yu Hui | $1,048,000 | |
| Previous Owner | Shanmuganandan Aravindakumar | $708,900 |
Source: Public Records
Tax History Compared to Growth
Tax History
| Year | Tax Paid | Tax Assessment Tax Assessment Total Assessment is a certain percentage of the fair market value that is determined by local assessors to be the total taxable value of land and additions on the property. | Land | Improvement |
|---|---|---|---|---|
| 2025 | $22,510 | $1,461,325 | $819,904 | $641,421 |
| 2024 | $22,264 | $1,432,673 | $803,828 | $628,845 |
| 2023 | $22,264 | $1,404,582 | $788,067 | $616,515 |
| 2022 | $21,776 | $1,377,042 | $772,615 | $604,427 |
| 2021 | $21,405 | $1,350,042 | $757,466 | $592,576 |
| 2019 | $20,922 | $1,310,000 | $735,000 | $575,000 |
| 2018 | $16,851 | $974,561 | $451,574 | $522,987 |
| 2017 | $16,896 | $955,453 | $442,720 | $512,733 |
| 2016 | $16,685 | $936,720 | $434,040 | $502,680 |
| 2015 | $16,357 | $922,651 | $427,521 | $495,130 |
| 2014 | $16,239 | $904,579 | $419,147 | $485,432 |
Source: Public Records
Map
Nearby Homes
- 1132 Hoskins Ln
- 6278 Murdock Way
- 4440 Pine Mountain Way
- 4519 Spring Mountain Way
- 4386 Healdsburg Way
- 4247 Healdsburg Way
- 6130 Yardley Ln
- 7240 Carneros Ln
- 7213 Calistoga Ln
- 5430 Sherwood Way
- 4067 St Helena Way
- 4069 Chalk Hill Way
- 7129 Calistoga Ln
- 3988 Windsor Way
- 1628 Banbury Dr
- 4107 Wallis Ranch Dr
- 7211 Kylemore Ct
- 3055 Hastings Way
- 3898 Highpointe Ct
- 224 Riverland Ct
- 5627 Lysander Way
- 5615 Lysander Way
- 5520 Thayer Ln
- 5512 Thayer Ln
- 5528 Thayer Ln
- 5633 Lysander Way
- 5639 Lysander Way
- 5606 Lysander Way
- 5612 Lysander Way
- 5600 Lysander Way
- 5551 Thayer Ln
- 5519 Thayer Ln
- 5509 Thayer Ln
- 5651 Lysander Way
- 5501 Thayer Ln
- 5537 Thayer Ln
- 809 Thayer Ct
- 5559 Thayer Ln
- 800 Thayer Ct
- 5555 Thayer Ln