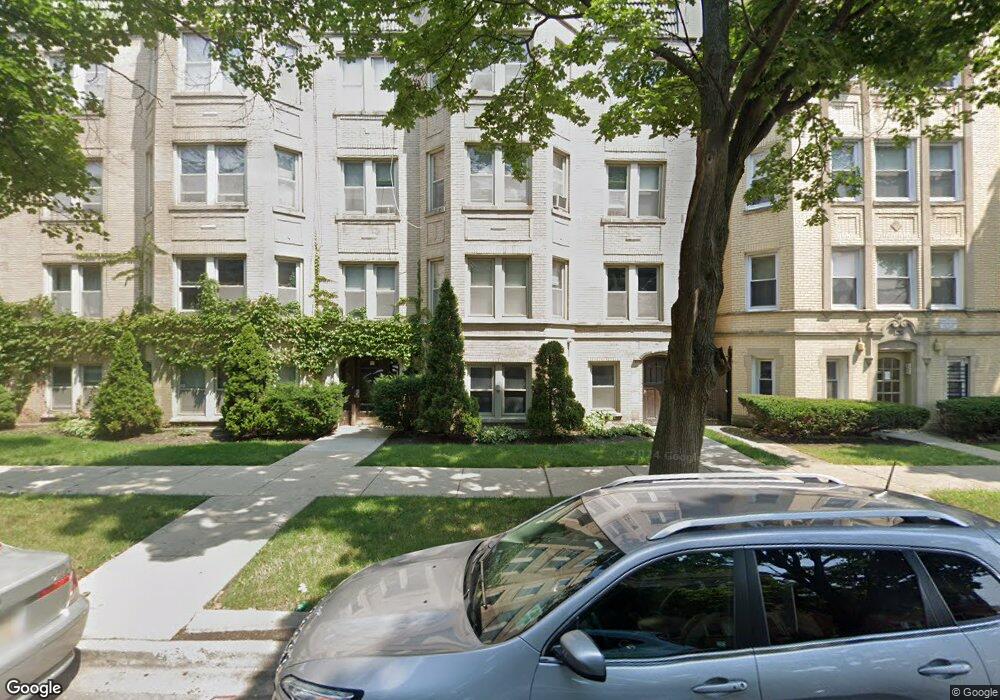
5621 N Spaulding Ave Unit 5621 Chicago, IL 60659
North Park NeighborhoodEstimated Value: $164,000 - $169,723
2
Beds
1
Bath
23,564
Sq Ft
$7/Sq Ft
Est. Value
About This Home
This home is located at 5621 N Spaulding Ave Unit 5621, Chicago, IL 60659 and is currently estimated at $166,931, approximately $7 per square foot. 5621 N Spaulding Ave Unit 5621 is a home located in Cook County with nearby schools including Peterson Elementary School, Mather High School, and ICC School.
Ownership History
Date
Name
Owned For
Owner Type
Purchase Details
Closed on
Jun 16, 2020
Sold by
Manager Of Titan Capital Inc
Bought by
Kulasic Adis and Seniv Sofia
Current Estimated Value
Home Financials for this Owner
Home Financials are based on the most recent Mortgage that was taken out on this home.
Original Mortgage
$84,000
Outstanding Balance
$74,906
Interest Rate
3.87%
Mortgage Type
New Conventional
Estimated Equity
$92,025
Purchase Details
Closed on
Feb 21, 2020
Sold by
County Of Cook
Bought by
Titan Capital Llc
Purchase Details
Closed on
Jan 29, 2013
Sold by
Federal Home Loan Mortgage Corporation
Bought by
Jeanne Rutagwibira Aloys and Jeanne Uwara Marie
Purchase Details
Closed on
May 21, 2012
Sold by
Davis Lachanda C
Bought by
Federal Home Loan Mortgage Corporation
Purchase Details
Closed on
Aug 17, 2007
Sold by
5621 N Spaulding Development Llc
Bought by
Davis Wayne Andrew and Davis Lachanda C
Create a Home Valuation Report for This Property
The Home Valuation Report is an in-depth analysis detailing your home's value as well as a comparison with similar homes in the area
Home Values in the Area
Average Home Value in this Area
Purchase History
| Date | Buyer | Sale Price | Title Company |
|---|---|---|---|
| Kulasic Adis | $112,000 | Attorneys Ttl Guaranty Fund | |
| Titan Capital Llc | -- | Attorney | |
| Jeanne Rutagwibira Aloys | $57,000 | Attorneys Title Guaranty Fun | |
| Federal Home Loan Mortgage Corporation | -- | None Available | |
| Davis Wayne Andrew | $180,000 | Cti |
Source: Public Records
Mortgage History
| Date | Status | Borrower | Loan Amount |
|---|---|---|---|
| Open | Kulasic Adis | $84,000 |
Source: Public Records
Tax History
| Year | Tax Paid | Tax Assessment Tax Assessment Total Assessment is a certain percentage of the fair market value that is determined by local assessors to be the total taxable value of land and additions on the property. | Land | Improvement |
|---|---|---|---|---|
| 2025 | $2,557 | $15,253 | $1,457 | $13,796 |
| 2024 | $2,557 | $15,253 | $1,457 | $13,796 |
| 2023 | $2,493 | $12,078 | $1,166 | $10,912 |
| 2022 | $2,493 | $12,078 | $1,166 | $10,912 |
| 2021 | $2,436 | $12,076 | $1,165 | $10,911 |
| 2020 | $2,238 | $10,012 | $603 | $9,409 |
| 2019 | $2,255 | $11,188 | $603 | $10,585 |
| 2018 | $2,217 | $11,188 | $603 | $10,585 |
| 2017 | $3,015 | $13,958 | $541 | $13,417 |
| 2016 | $2,805 | $13,958 | $541 | $13,417 |
| 2015 | $3,766 | $20,481 | $541 | $19,940 |
| 2014 | $2,225 | $11,948 | $499 | $11,449 |
| 2013 | $2,181 | $11,948 | $499 | $11,449 |
Source: Public Records
Map
Nearby Homes
- 3251 W Olive Ave Unit 1
- 5637 N Christiana Ave
- 5721 N Jersey Ave
- 5715 N Kimball Ave Unit 1N
- 5717 N Kimball Ave Unit 2N
- 5706 N Saint Louis Ave
- 5404 N Christiana Ave
- 5907 N Virginia Ave
- 5832 N Sacramento Ave
- 5620 N Francisco Ave
- 5940 N Bernard St
- 5824 N Lincoln Ave Unit 2S
- 5830 N Lincoln Ave Unit 1S
- 5830 N Lincoln Ave Unit 2E
- 5830 N Lincoln Ave Unit 2W
- 5706 N Mozart St
- 6040 N Troy St Unit 306
- 2851 W Rascher Ave
- 2800 W Bryn Mawr Ave
- 5343 N Francisco Ave Unit 2N
- 5625 N Spaulding Ave Unit 1N
- 5625 N Spaulding Ave Unit 5625
- 5625 N Spaulding Ave Unit 5625
- 5625 N Spaulding Ave Unit 5625
- 5625 N Spaulding Ave Unit 5625
- 5625 N Spaulding Ave Unit G
- 5625 N Spaulding Ave Unit 1
- 5625 N Spaulding Ave Unit 3N
- 5625 N Spaulding Ave Unit 2N
- 5625 N Spaulding Ave Unit 3
- 3253 N Spaulding Ave Unit 3W
- 3253 N Spaulding Ave Unit 3
- 3253 Spaulding
- 3257 Spaulding
- 3259 Spaulding
- 5621 N Spaulding Ave Unit 5621
- 5621 N Spaulding Ave Unit 5621
- 5621 N Spaulding Ave Unit 2
- 5621 N Spaulding Ave Unit 1
- 5621 N Spaulding Ave Unit 2S
Your Personal Tour Guide
Ask me questions while you tour the home.