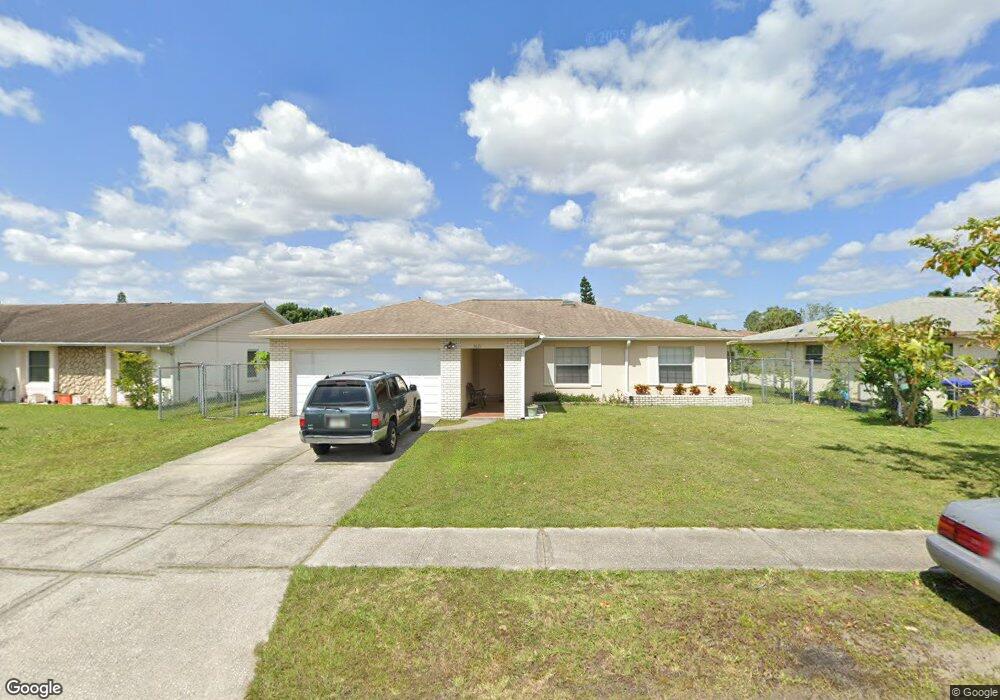
5621 Nokomis Cir Orlando, FL 32839
Estimated Value: $344,892 - $378,000
4
Beds
2
Baths
1,664
Sq Ft
$219/Sq Ft
Est. Value
About This Home
This home is located at 5621 Nokomis Cir, Orlando, FL 32839 and is currently estimated at $363,973, approximately $218 per square foot. 5621 Nokomis Cir is a home located in Orange County with nearby schools including Palmetto Elementary School, Westridge Middle School, and Oak Ridge High School.
Ownership History
Date
Name
Owned For
Owner Type
Purchase Details
Closed on
Aug 20, 2024
Sold by
Ngoc Thu D and Ngoc Phung Khanh
Bought by
Phung Khanh Ngoc
Current Estimated Value
Purchase Details
Closed on
Aug 6, 2024
Sold by
Phung Thu Diem and Phung Khanh Ngoc
Bought by
Phung Khanh Ngoc
Purchase Details
Closed on
Oct 19, 2007
Sold by
Phung Thu D and Phung Minh Ngoc
Bought by
Phung Thu D and Phung Khanh Ngoc
Purchase Details
Closed on
Jun 9, 1999
Sold by
Thilam Suvune
Bought by
Phung Minh N
Purchase Details
Closed on
Dec 2, 1997
Sold by
Phung An Ngoc and Lam Suvune T
Bought by
Lam Suvune T and Phung Thu D
Purchase Details
Closed on
Jan 26, 1994
Sold by
Dye Const & Dev Inc
Bought by
Phung An and Lam Suvune Thi
Home Financials for this Owner
Home Financials are based on the most recent Mortgage that was taken out on this home.
Original Mortgage
$81,833
Interest Rate
7.1%
Mortgage Type
FHA
Create a Home Valuation Report for This Property
The Home Valuation Report is an in-depth analysis detailing your home's value as well as a comparison with similar homes in the area
Home Values in the Area
Average Home Value in this Area
Purchase History
| Date | Buyer | Sale Price | Title Company |
|---|---|---|---|
| Phung Khanh Ngoc | $100 | None Listed On Document | |
| Phung Khanh Ngoc | $100 | None Listed On Document | |
| Phung Thu D | $17,000 | None Available | |
| Phung Minh N | $38,200 | -- | |
| Lam Suvune T | $100 | -- | |
| Phung An | $83,200 | -- |
Source: Public Records
Mortgage History
| Date | Status | Borrower | Loan Amount |
|---|---|---|---|
| Previous Owner | Phung An | $81,833 |
Source: Public Records
Tax History Compared to Growth
Tax History
| Year | Tax Paid | Tax Assessment Tax Assessment Total Assessment is a certain percentage of the fair market value that is determined by local assessors to be the total taxable value of land and additions on the property. | Land | Improvement |
|---|---|---|---|---|
| 2025 | $1,469 | $108,946 | -- | -- |
| 2024 | $1,374 | $108,946 | -- | -- |
| 2023 | $1,374 | $102,792 | $0 | $0 |
| 2022 | $1,297 | $99,798 | $0 | $0 |
| 2021 | $1,263 | $96,891 | $0 | $0 |
| 2020 | $1,196 | $95,553 | $0 | $0 |
| 2019 | $1,211 | $93,405 | $0 | $0 |
| 2018 | $1,193 | $91,663 | $0 | $0 |
| 2017 | $1,162 | $134,514 | $17,000 | $117,514 |
| 2016 | $1,135 | $126,029 | $12,000 | $114,029 |
| 2015 | $1,148 | $107,909 | $12,000 | $95,909 |
| 2014 | $1,183 | $102,615 | $20,000 | $82,615 |
Source: Public Records
Map
Nearby Homes
- 5445 Arpana Dr
- 5445 Gambier Ct
- 2467 Myakka Dr
- 2369 Tom Jones St Unit 8
- 2345 Tom Jones St Unit 4
- 5144 Picadilly Circus Ct Unit 2
- 5150 Picadilly Circus Ct Unit 7
- 5137 Picadilly Circus Ct Unit 3
- 3701 Castle Pines Ln Unit 3926
- 3701 Castle Pines Ln Unit 3927
- 3701 Castle Pines Ln Unit 3914
- 5125 Picadilly Circus Ct Unit 3
- 5123 Picadilly Circus Ct Unit 2
- 5084 Downing St Unit 2
- 3700 Castle Pines Ln Unit 4032
- 3700 Castle Pines Ln Unit 4024
- 2013 Pineway Dr
- 3712 Castle Pines Ln Unit 4137
- 2352 Grand Central Pkwy Unit 10
- 3702 Palm Desert Ln Unit 5423
- 5615 Nokomis Cir
- 5635 Nokomis Cir
- 5449 Arpana Dr
- 5453 Arpana Dr
- 5609 Nokomis Cir
- 5641 Nokomis Cir
- 5457 Arpana Dr
- 5634 Nokomis Cir
- 5616 Nokomis Cir Unit 4
- 5577 Nokomis Cir
- 5640 Nokomis Cir
- 5647 Nokomis Cir
- 5610 Nokomis Cir
- 5461 Arpana Dr
- 5571 Nokomis Cir
- 5437 Arpana Dr
- 5646 Nokomis Cir
- 5576 Nokomis Cir Unit 4
- 5430 Wauchula Ct
- 5448 Arpana Dr