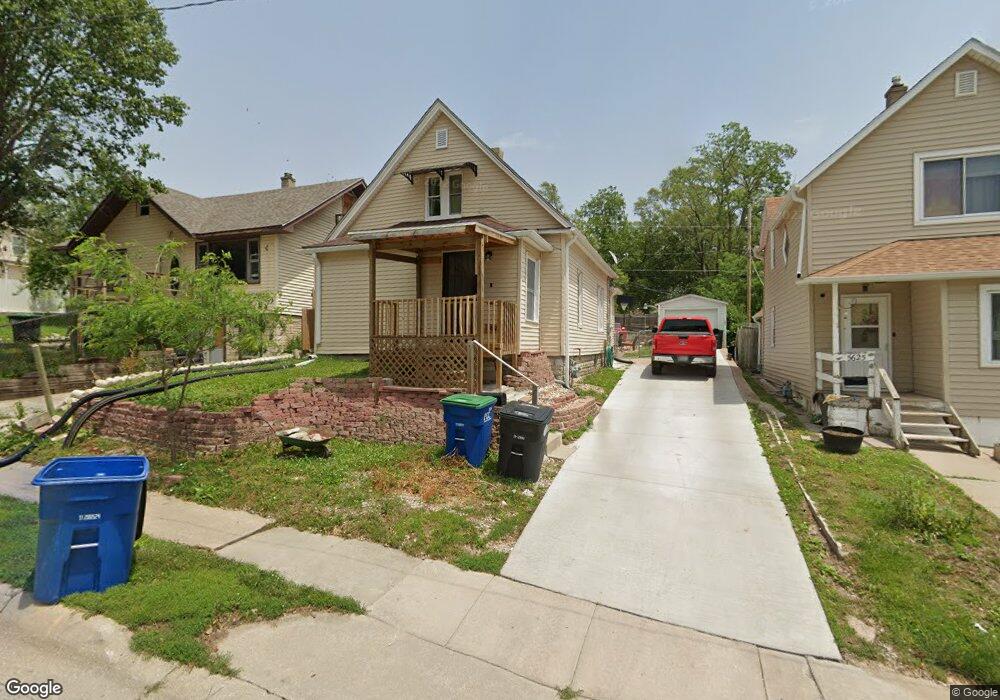
5621 S 33rd Ave Omaha, NE 68107
South Central Omaha NeighborhoodEstimated Value: $140,000 - $193,000
2
Beds
1
Bath
948
Sq Ft
$171/Sq Ft
Est. Value
About This Home
This home is located at 5621 S 33rd Ave, Omaha, NE 68107 and is currently estimated at $162,053, approximately $170 per square foot. 5621 S 33rd Ave is a home located in Douglas County with nearby schools including Indian Hill Elementary School, Sts. Peter and Paul School, and Assumption-Guadalupe School.
Ownership History
Date
Name
Owned For
Owner Type
Purchase Details
Closed on
Nov 29, 2021
Sold by
Doris Hernandez
Bought by
Hernandez Doris L and Hernandez Daniel Alejandro
Current Estimated Value
Home Financials for this Owner
Home Financials are based on the most recent Mortgage that was taken out on this home.
Original Mortgage
$42,009
Interest Rate
2.37%
Mortgage Type
FHA
Purchase Details
Closed on
Nov 14, 2006
Sold by
Allen Billie D
Bought by
Hernandez Doris L
Create a Home Valuation Report for This Property
The Home Valuation Report is an in-depth analysis detailing your home's value as well as a comparison with similar homes in the area
Home Values in the Area
Average Home Value in this Area
Purchase History
| Date | Buyer | Sale Price | Title Company |
|---|---|---|---|
| Hernandez Doris L | -- | Rosenberg Pllc | |
| Hernandez Doris L | $58,000 | -- |
Source: Public Records
Mortgage History
| Date | Status | Borrower | Loan Amount |
|---|---|---|---|
| Previous Owner | Hernandez Doris L | $42,009 |
Source: Public Records
Tax History Compared to Growth
Tax History
| Year | Tax Paid | Tax Assessment Tax Assessment Total Assessment is a certain percentage of the fair market value that is determined by local assessors to be the total taxable value of land and additions on the property. | Land | Improvement |
|---|---|---|---|---|
| 2024 | $2,135 | $101,200 | $7,800 | $93,400 |
| 2023 | $2,135 | $101,200 | $7,800 | $93,400 |
| 2022 | $1,898 | $88,900 | $5,500 | $83,400 |
| 2021 | $1,543 | $72,900 | $5,500 | $67,400 |
| 2020 | $1,597 | $74,600 | $5,500 | $69,100 |
| 2019 | $1,501 | $69,900 | $5,500 | $64,400 |
| 2018 | $1,393 | $64,800 | $5,500 | $59,300 |
| 2017 | $1,115 | $51,600 | $4,000 | $47,600 |
| 2016 | $1,107 | $51,600 | $4,000 | $47,600 |
| 2015 | $1,092 | $51,600 | $4,000 | $47,600 |
| 2014 | $1,092 | $51,600 | $4,000 | $47,600 |
Source: Public Records
Map
Nearby Homes