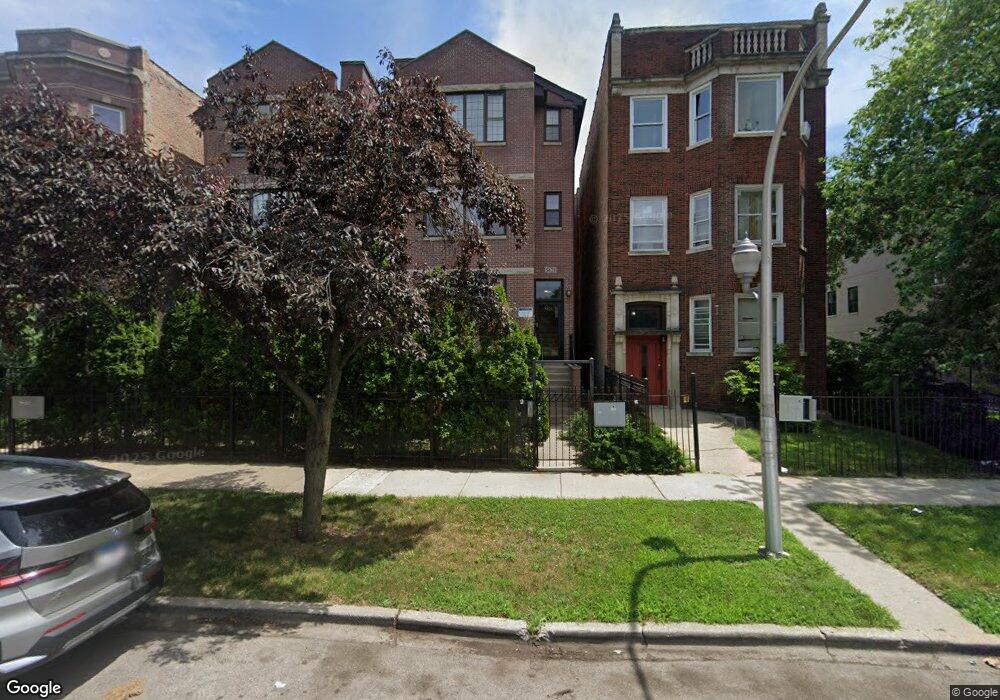
5621 S Calumet Ave Unit 56212 Chicago, IL 60637
Washington Park NeighborhoodEstimated Value: $194,796 - $223,000
3
Beds
2
Baths
1,400
Sq Ft
$147/Sq Ft
Est. Value
About This Home
This home is located at 5621 S Calumet Ave Unit 56212, Chicago, IL 60637 and is currently estimated at $205,699, approximately $146 per square foot. 5621 S Calumet Ave Unit 56212 is a home located in Cook County with nearby schools including Carter Elementary School, Wendell Phillips Academy High School, and CICS Washington Park.
Ownership History
Date
Name
Owned For
Owner Type
Purchase Details
Closed on
Oct 24, 2023
Sold by
Kofoworola Bashira
Bought by
Oluwa Bilikis
Current Estimated Value
Home Financials for this Owner
Home Financials are based on the most recent Mortgage that was taken out on this home.
Original Mortgage
$179,450
Outstanding Balance
$176,167
Interest Rate
7.5%
Mortgage Type
New Conventional
Estimated Equity
$29,532
Purchase Details
Closed on
Dec 11, 2012
Sold by
Howell John T
Bought by
Kofoworola Bashira
Purchase Details
Closed on
Nov 1, 2012
Sold by
Clark Marlon E and Clark Connie
Bought by
Howell John T
Purchase Details
Closed on
Aug 14, 2007
Sold by
Sokolowski Marek and Olejniczak Edward
Bought by
Clark Marlon E and Clark Connie
Home Financials for this Owner
Home Financials are based on the most recent Mortgage that was taken out on this home.
Original Mortgage
$208,000
Interest Rate
6.63%
Mortgage Type
Unknown
Create a Home Valuation Report for This Property
The Home Valuation Report is an in-depth analysis detailing your home's value as well as a comparison with similar homes in the area
Home Values in the Area
Average Home Value in this Area
Purchase History
| Date | Buyer | Sale Price | Title Company |
|---|---|---|---|
| Oluwa Bilikis | $185,000 | Old Republic Title | |
| Kofoworola Bashira | -- | None Available | |
| Howell John T | $50,000 | Saturn Title Llc | |
| Clark Marlon E | $208,000 | Pntn |
Source: Public Records
Mortgage History
| Date | Status | Borrower | Loan Amount |
|---|---|---|---|
| Open | Oluwa Bilikis | $179,450 | |
| Previous Owner | Clark Marlon E | $208,000 |
Source: Public Records
Tax History Compared to Growth
Tax History
| Year | Tax Paid | Tax Assessment Tax Assessment Total Assessment is a certain percentage of the fair market value that is determined by local assessors to be the total taxable value of land and additions on the property. | Land | Improvement |
|---|---|---|---|---|
| 2024 | $2,117 | $16,879 | $4,005 | $12,874 |
| 2023 | $2,063 | $10,000 | $4,009 | $5,991 |
| 2022 | $2,063 | $10,000 | $4,009 | $5,991 |
| 2021 | $2,017 | $9,999 | $4,008 | $5,991 |
| 2020 | $1,966 | $8,825 | $1,945 | $6,880 |
| 2019 | $1,955 | $9,731 | $1,945 | $7,786 |
| 2018 | $2,067 | $10,463 | $1,945 | $8,518 |
| 2017 | $1,869 | $8,684 | $1,601 | $7,083 |
| 2016 | $1,739 | $8,684 | $1,601 | $7,083 |
| 2015 | $1,591 | $8,684 | $1,601 | $7,083 |
| 2014 | $1,969 | $10,614 | $1,373 | $9,241 |
| 2013 | $1,930 | $10,614 | $1,373 | $9,241 |
Source: Public Records
Map
Nearby Homes
- 5615 S Calumet Ave Unit 2N
- 5619 S Calumet Ave Unit 2
- 5739 S Calumet Ave Unit P2
- 5714 S Prairie Ave
- 5700 S Indiana Ave
- 5704 S Indiana Ave
- 5341 S Calumet Ave
- 5716 S Indiana Ave
- 5333 S Calumet Ave
- 5331 S Calumet Ave
- 5530 S Michigan Ave
- 5410 S Indiana Ave
- 5729 S Michigan Ave
- 5317 S Prairie Ave
- 5741 S Michigan Ave Unit 1N
- 5408 S Michigan Ave Unit 1S
- 209 E 53rd St
- 5644 S Wabash Ave
- 5900 S King Dr Unit 59002
- 5900 S King Dr Unit 3
- 5621 S Calumet Ave Unit 56214
- 5621 S Calumet Ave Unit 56213
- 5621 S Calumet Ave Unit 56211
- 5621 S Calumet Ave Unit 3
- 5621 S Calumet Ave Unit 2
- 5621 S Calumet Ave Unit D
- 5621 S Calumet Ave Unit 4
- 5621 S Calumet Ave Unit 1
- 5613 S Calumet Ave
- 5613 S Calumet Ave Unit 3
- 5613 S Calumet Ave Unit 1
- 5617 S Calumet Ave Unit 1S
- 5617 S Calumet Ave Unit 1S
- 5617 S Calumet Ave Unit BASE
- 5619 S Calumet Ave Unit 1
- 5619 S Calumet Ave Unit 56194
- 5619 S Calumet Ave Unit 56193
- 5619 S Calumet Ave Unit 56192
- 5619 S Calumet Ave Unit 56191
- 5619 S Calumet Ave Unit 4