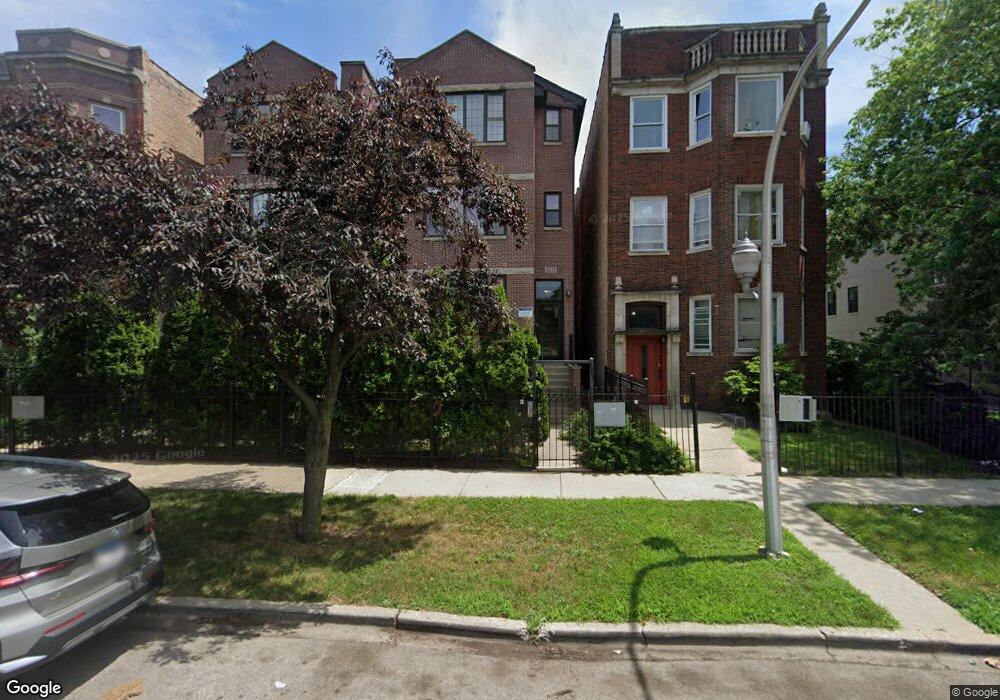
5621 S Calumet Ave Unit 56214 Chicago, IL 60637
Washington Park NeighborhoodEstimated Value: $167,000 - $212,000
3
Beds
2
Baths
1,400
Sq Ft
$134/Sq Ft
Est. Value
About This Home
This home is located at 5621 S Calumet Ave Unit 56214, Chicago, IL 60637 and is currently estimated at $186,992, approximately $133 per square foot. 5621 S Calumet Ave Unit 56214 is a home located in Cook County with nearby schools including Carter Elementary School, Wendell Phillips Academy High School, and CICS Washington Park.
Ownership History
Date
Name
Owned For
Owner Type
Purchase Details
Closed on
May 13, 2019
Sold by
Sow Community Development Corporation
Bought by
Kohli Gurpreet Kaur
Current Estimated Value
Purchase Details
Closed on
Mar 20, 2019
Sold by
Fannie Mae
Bought by
Sow Community Development Corporation
Purchase Details
Closed on
Aug 10, 2018
Sold by
Blake David L
Bought by
Federal National Mortgage Association
Purchase Details
Closed on
Mar 26, 2008
Sold by
Sokolowski Marek and Olejniczak Edward
Bought by
Blake David L
Home Financials for this Owner
Home Financials are based on the most recent Mortgage that was taken out on this home.
Original Mortgage
$229,000
Interest Rate
6.1%
Mortgage Type
Unknown
Create a Home Valuation Report for This Property
The Home Valuation Report is an in-depth analysis detailing your home's value as well as a comparison with similar homes in the area
Home Values in the Area
Average Home Value in this Area
Purchase History
| Date | Buyer | Sale Price | Title Company |
|---|---|---|---|
| Kohli Gurpreet Kaur | -- | Attorney | |
| Sow Community Development Corporation | $115,000 | Chicago Title | |
| Federal National Mortgage Association | -- | None Available | |
| Blake David L | $229,000 | Pntn |
Source: Public Records
Mortgage History
| Date | Status | Borrower | Loan Amount |
|---|---|---|---|
| Previous Owner | Blake David L | $229,000 |
Source: Public Records
Tax History Compared to Growth
Tax History
| Year | Tax Paid | Tax Assessment Tax Assessment Total Assessment is a certain percentage of the fair market value that is determined by local assessors to be the total taxable value of land and additions on the property. | Land | Improvement |
|---|---|---|---|---|
| 2024 | $2,328 | $18,505 | $4,391 | $14,114 |
| 2023 | $2,269 | $11,000 | $4,395 | $6,605 |
| 2022 | $2,269 | $11,000 | $4,395 | $6,605 |
| 2021 | $2,218 | $10,999 | $4,395 | $6,604 |
| 2020 | $2,155 | $9,675 | $2,132 | $7,543 |
| 2019 | $1,454 | $10,668 | $2,132 | $8,536 |
| 2018 | $1,587 | $11,471 | $2,132 | $9,339 |
| 2017 | $1,323 | $9,522 | $1,756 | $7,766 |
| 2016 | $1,407 | $9,522 | $1,756 | $7,766 |
| 2015 | $1,264 | $9,522 | $1,756 | $7,766 |
| 2014 | $1,682 | $11,636 | $1,505 | $10,131 |
| 2013 | $1,638 | $11,636 | $1,505 | $10,131 |
Source: Public Records
Map
Nearby Homes
- 5619 S Calumet Ave Unit 2
- 5615 S Calumet Ave Unit 2N
- 5714 S Prairie Ave
- 5739 S Calumet Ave Unit P2
- 5700 S Indiana Ave
- 5704 S Indiana Ave
- 5716 S Indiana Ave
- 5530 S Michigan Ave
- 5729 S Michigan Ave
- 5741 S Michigan Ave Unit 1N
- 5341 S Calumet Ave
- 5410 S Indiana Ave
- 5333 S Calumet Ave
- 5331 S Calumet Ave
- 5900 S King Dr Unit 59002
- 5900 S King Dr Unit 3
- 5644 S Wabash Ave
- 5317 S Prairie Ave
- 5646 S Wabash Ave
- 5906 S Calumet Ave
- 5621 S Calumet Ave Unit 56213
- 5621 S Calumet Ave Unit 56212
- 5621 S Calumet Ave Unit 56211
- 5621 S Calumet Ave Unit 3
- 5621 S Calumet Ave Unit 2
- 5621 S Calumet Ave Unit D
- 5621 S Calumet Ave Unit 4
- 5621 S Calumet Ave Unit 1
- 5613 S Calumet Ave
- 5613 S Calumet Ave Unit 3
- 5613 S Calumet Ave Unit 1
- 5617 S Calumet Ave Unit 1S
- 5617 S Calumet Ave Unit 1S
- 5617 S Calumet Ave Unit BASE
- 5619 S Calumet Ave Unit 1
- 5619 S Calumet Ave Unit 56194
- 5619 S Calumet Ave Unit 56193
- 5619 S Calumet Ave Unit 56192
- 5619 S Calumet Ave Unit 56191
- 5619 S Calumet Ave Unit 4