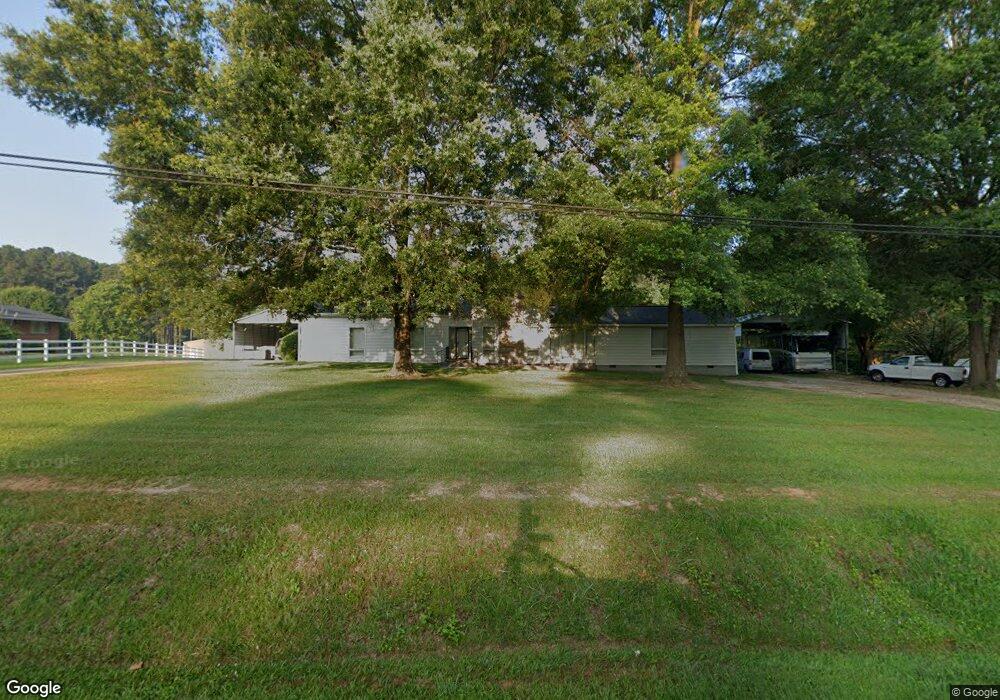
5622 Old Stage Rd Raleigh, NC 27603
Estimated Value: $391,000 - $462,745
Studio
3
Baths
2,677
Sq Ft
$156/Sq Ft
Est. Value
About This Home
This home is located at 5622 Old Stage Rd, Raleigh, NC 27603 and is currently estimated at $417,686, approximately $156 per square foot. 5622 Old Stage Rd is a home located in Wake County with nearby schools including Vandora Springs Elementary, North Garner Middle, and Garner High.
Ownership History
Date
Name
Owned For
Owner Type
Purchase Details
Closed on
Oct 23, 2013
Sold by
Liles Mildred C
Bought by
Johnson Jarvis L and Johnson Diane L
Current Estimated Value
Home Financials for this Owner
Home Financials are based on the most recent Mortgage that was taken out on this home.
Original Mortgage
$145,000
Outstanding Balance
$108,233
Interest Rate
4.33%
Mortgage Type
New Conventional
Estimated Equity
$309,453
Purchase Details
Closed on
Oct 15, 2010
Sold by
Liles Mildred C
Bought by
Liles Mildred C and Johnson Diane L
Purchase Details
Closed on
Sep 22, 2010
Sold by
Liles Mildred C
Bought by
Johnson Diane L
Purchase Details
Closed on
Jan 5, 2000
Sold by
Estate Of Mary M Gentry and Gentry Benjamin F
Bought by
Liles Mildred C
Home Financials for this Owner
Home Financials are based on the most recent Mortgage that was taken out on this home.
Original Mortgage
$135,000
Interest Rate
7.8%
Create a Home Valuation Report for This Property
The Home Valuation Report is an in-depth analysis detailing your home's value as well as a comparison with similar homes in the area
Home Values in the Area
Average Home Value in this Area
Purchase History
| Date | Buyer | Sale Price | Title Company |
|---|---|---|---|
| Johnson Jarvis L | -- | None Available | |
| Liles Mildred C | -- | None Available | |
| Liles Mildred C | -- | None Available | |
| Johnson Diane L | -- | None Available | |
| Liles Mildred C | $150,000 | -- |
Source: Public Records
Mortgage History
| Date | Status | Borrower | Loan Amount |
|---|---|---|---|
| Open | Johnson Jarvis L | $145,000 | |
| Previous Owner | Liles Mildred C | $135,000 |
Source: Public Records
Tax History
| Year | Tax Paid | Tax Assessment Tax Assessment Total Assessment is a certain percentage of the fair market value that is determined by local assessors to be the total taxable value of land and additions on the property. | Land | Improvement |
|---|---|---|---|---|
| 2025 | $2,329 | $360,937 | $210,600 | $150,337 |
| 2024 | $2,261 | $360,937 | $210,600 | $150,337 |
Source: Public Records
Map
Nearby Homes
- 725 Colonial Dr
- 700 Woodland Rd
- 626 Maple Ln
- 608 Poplar Springs Church Rd
- 116 Sunny Acres Rd
- 328 Grand Silo Rd
- 564 Wheatland Country Rd
- 568 Wheatland Country Rd
- 580 Wheatland Country Rd
- 336 Grand Silo Rd
- 352 Grand Silo Rd
- 356 Grand Silo Rd
- 565 Wheatland Country Rd
- 569 Wheatland Country Rd
- 360 Grand Silo Rd
- 5931 S Sharon Dr
- 608 Pasture Ridge Rd
- 612 Pasture Ridge Rd
- 620 Pasture Ridge Rd
- 624 Pasture Ridge Rd
- 5616 Old Stage Rd
- 5703 Old Stage Rd
- 5612 Old Stage Rd
- 5707 Old Stage Rd
- 5711 Old Stage Rd
- 5808 Old Stage Rd
- 5604 Old Stage Rd
- 5700 Old Stage Rd
- 1013 E Woodcrest Dr
- 819 Colonial Dr
- 5619 Meadowbrook Rd
- 5615 Meadowbrook Rd
- 5701 Meadowbrook Rd
- 5812 Old Stage Rd
- 5611 Meadowbrook Rd
- 1015 E Woodcrest Dr
- 815 Colonial Dr
- 1017 E Woodcrest Dr
- 816 Woodland Rd
- 5510 Old Stage Rd
Your Personal Tour Guide
Ask me questions while you tour the home.