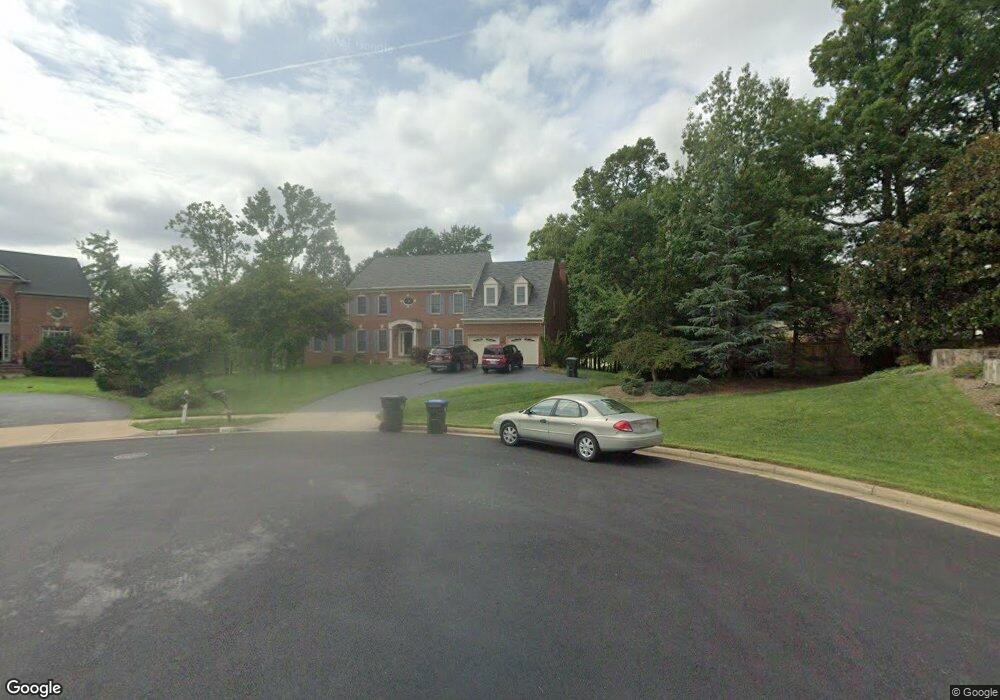
5622 Willow Valley Rd Clifton, VA 20124
Estimated Value: $1,031,743 - $1,164,000
5
Beds
4
Baths
3,394
Sq Ft
$320/Sq Ft
Est. Value
About This Home
This home is located at 5622 Willow Valley Rd, Clifton, VA 20124 and is currently estimated at $1,087,186, approximately $320 per square foot. 5622 Willow Valley Rd is a home located in Fairfax County with nearby schools including Willow Springs Elementary School, Johnson Middle School, and Fairfax High.
Ownership History
Date
Name
Owned For
Owner Type
Purchase Details
Closed on
Jun 20, 1996
Sold by
Laurel Rock Lc
Bought by
Moy Get W
Current Estimated Value
Home Financials for this Owner
Home Financials are based on the most recent Mortgage that was taken out on this home.
Original Mortgage
$342,800
Outstanding Balance
$22,321
Interest Rate
8.21%
Estimated Equity
$1,064,865
Purchase Details
Closed on
Mar 18, 1996
Sold by
Moore Road Lc
Bought by
Laurel Rock Lc
Purchase Details
Closed on
May 25, 1994
Sold by
Moore Rd Lc
Bought by
Roamer Prop Lc
Purchase Details
Closed on
Dec 13, 1993
Sold by
Leonard M R
Bought by
Moore Rd Lc
Home Financials for this Owner
Home Financials are based on the most recent Mortgage that was taken out on this home.
Original Mortgage
$55,000
Interest Rate
6.78%
Create a Home Valuation Report for This Property
The Home Valuation Report is an in-depth analysis detailing your home's value as well as a comparison with similar homes in the area
Home Values in the Area
Average Home Value in this Area
Purchase History
| Date | Buyer | Sale Price | Title Company |
|---|---|---|---|
| Moy Get W | $380,990 | -- | |
| Laurel Rock Lc | $215,000 | -- | |
| Roamer Prop Lc | $101,666 | -- | |
| Moore Rd Lc | $55,350 | -- |
Source: Public Records
Mortgage History
| Date | Status | Borrower | Loan Amount |
|---|---|---|---|
| Open | Moore Rd Lc | $342,800 | |
| Previous Owner | Moore Rd Lc | $55,000 |
Source: Public Records
Tax History Compared to Growth
Tax History
| Year | Tax Paid | Tax Assessment Tax Assessment Total Assessment is a certain percentage of the fair market value that is determined by local assessors to be the total taxable value of land and additions on the property. | Land | Improvement |
|---|---|---|---|---|
| 2025 | $10,712 | $971,640 | $357,000 | $614,640 |
| 2024 | $10,712 | $924,650 | $337,000 | $587,650 |
| 2023 | $10,435 | $924,650 | $337,000 | $587,650 |
| 2022 | $9,577 | $837,520 | $317,000 | $520,520 |
| 2021 | $8,817 | $751,380 | $272,000 | $479,380 |
| 2020 | $8,747 | $739,070 | $272,000 | $467,070 |
| 2019 | $8,541 | $721,650 | $272,000 | $449,650 |
| 2018 | $8,201 | $713,170 | $272,000 | $441,170 |
| 2017 | $7,962 | $685,750 | $257,000 | $428,750 |
| 2016 | $7,944 | $685,750 | $257,000 | $428,750 |
| 2015 | $7,503 | $672,340 | $252,000 | $420,340 |
| 2014 | $7,255 | $651,520 | $242,000 | $409,520 |
Source: Public Records
Map
Nearby Homes
- 13342 Braddock Rd
- 13064 Quartz Ln
- 5680 White Dove Ln
- 13346 Regal Crest Dr
- 13244 Maple Creek Ln
- 13548 Gray Bill Ct
- 13678 Orchard Dr Unit 3678
- 13561 Ruddy Duck Rd
- 5500 Hampton Forest Way
- 13006 Pebblestone Ct
- 5816 Orchard Hill Ln
- 5809 Waterdale Ct
- 12977 Hampton Forest Ct
- 5331 Chalkstone Way
- 5653 Faircloth Ct
- 5280 Jule Star Dr
- 6117 Mountain Springs Ln
- 13644 Shreve St
- 5936 Spruce Run Ct
- 5123 Travis Edward Way Unit J
- 5617 Clifton Rd
- 5613 Clifton Rd
- 5621 Clifton Rd
- 5623 Willow Valley Rd
- 5620 Willow Valley Rd
- 5609 Clifton Rd
- 5621 Willow Valley Rd
- 5608 Willow Crossing Ct
- 5618 Willow Valley Rd
- 5625 Old Clifton Rd
- 5605 Clifton Rd
- 5610 Willow Crossing Ct
- 5619 Willow Valley Rd
- 5616 Willow Valley Rd
- 5617 Willow Valley Rd
- 5612 Willow Crossing Ct
- 5606 Willow Crossing Ct
- 13302 Clifton Park Cir
- 13301 Clifton Park Cir
- 5701 Old Clifton Rd