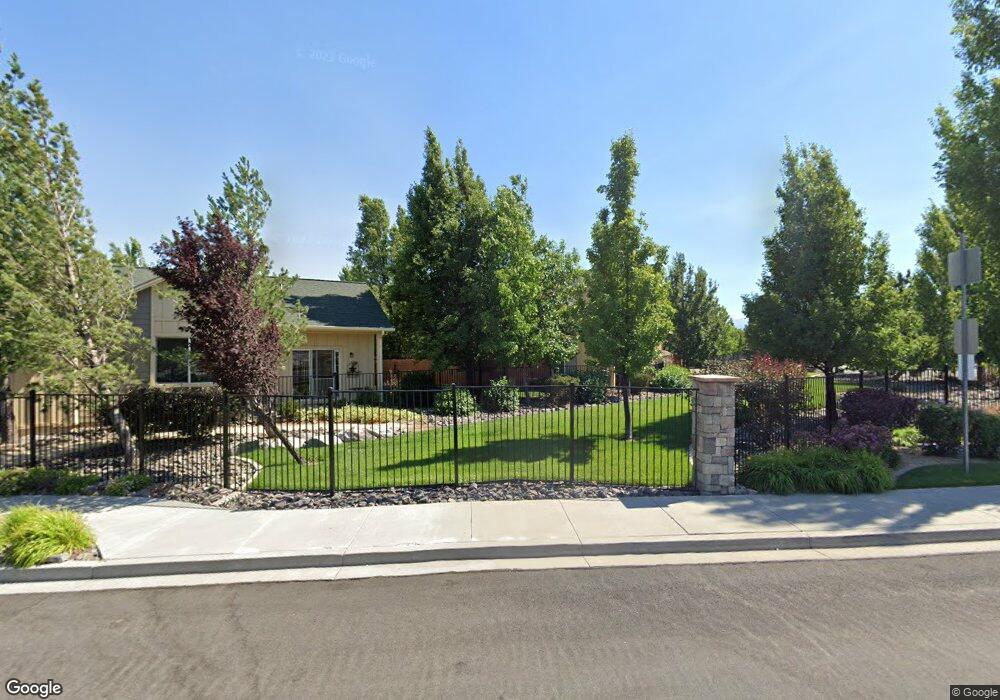
5623 Crescent Hill Way Sparks, NV 89436
Los Altos Parkway NeighborhoodEstimated Value: $428,000 - $455,000
2
Beds
3
Baths
1,769
Sq Ft
$249/Sq Ft
Est. Value
About This Home
This home is located at 5623 Crescent Hill Way, Sparks, NV 89436 and is currently estimated at $440,625, approximately $249 per square foot. 5623 Crescent Hill Way is a home located in Washoe County with nearby schools including Miguel Sepulveda Elementary School, Sky Ranch Middle School, and Edward C Reed High School.
Ownership History
Date
Name
Owned For
Owner Type
Purchase Details
Closed on
Oct 18, 2005
Sold by
Hanlon Dianne S
Bought by
Hanlon Michael B and Hanlon Dianne S
Current Estimated Value
Home Financials for this Owner
Home Financials are based on the most recent Mortgage that was taken out on this home.
Original Mortgage
$205,800
Outstanding Balance
$108,179
Interest Rate
5.67%
Mortgage Type
New Conventional
Estimated Equity
$332,446
Purchase Details
Closed on
Sep 3, 2003
Sold by
Hanlon Michael Brian
Bought by
Hanlon Dianne S
Home Financials for this Owner
Home Financials are based on the most recent Mortgage that was taken out on this home.
Original Mortgage
$181,700
Interest Rate
7.2%
Mortgage Type
Adjustable Rate Mortgage/ARM
Purchase Details
Closed on
Aug 27, 2003
Sold by
Reno Development Ltd
Bought by
Hanlon Dianne S
Home Financials for this Owner
Home Financials are based on the most recent Mortgage that was taken out on this home.
Original Mortgage
$181,700
Interest Rate
7.2%
Mortgage Type
Adjustable Rate Mortgage/ARM
Create a Home Valuation Report for This Property
The Home Valuation Report is an in-depth analysis detailing your home's value as well as a comparison with similar homes in the area
Home Values in the Area
Average Home Value in this Area
Purchase History
| Date | Buyer | Sale Price | Title Company |
|---|---|---|---|
| Hanlon Michael B | -- | First American Title | |
| Hanlon Dianne S | $201,894 | Western Title Incorporated | |
| Hanlon Dianne S | $201,894 | Western Title Incorporated |
Source: Public Records
Mortgage History
| Date | Status | Borrower | Loan Amount |
|---|---|---|---|
| Open | Hanlon Michael B | $205,800 | |
| Closed | Hanlon Dianne S | $181,700 |
Source: Public Records
Tax History Compared to Growth
Tax History
| Year | Tax Paid | Tax Assessment Tax Assessment Total Assessment is a certain percentage of the fair market value that is determined by local assessors to be the total taxable value of land and additions on the property. | Land | Improvement |
|---|---|---|---|---|
| 2026 | $1,361 | $92,480 | $26,091 | $66,389 |
| 2025 | $1,768 | $94,837 | $28,163 | $66,674 |
| 2024 | $1,768 | $94,605 | $25,636 | $68,970 |
| 2023 | $1,245 | $87,711 | $26,833 | $60,878 |
| 2022 | $1,668 | $75,145 | $22,586 | $52,559 |
| 2021 | $1,620 | $71,153 | $18,522 | $52,631 |
| 2020 | $1,569 | $70,907 | $17,955 | $52,952 |
| 2019 | $2,339 | $68,806 | $17,451 | $51,355 |
| 2018 | $2,189 | $63,224 | $12,978 | $50,246 |
| 2017 | $2,114 | $61,939 | $12,033 | $49,906 |
| 2016 | $2,046 | $59,243 | $11,088 | $48,155 |
| 2015 | $2,038 | $58,573 | $9,482 | $49,091 |
| 2014 | $1,968 | $49,560 | $7,592 | $41,968 |
| 2013 | -- | $39,546 | $5,220 | $34,326 |
Source: Public Records
Map
Nearby Homes
- 5575 Junction Peak Dr
- 2084 Great Bluffs Ln Unit Homesite 5132
- 601 W Equinox Peak Ct Unit Homesite 2030
- 601 W Equinox Peak Ct
- 5707 Rainier Peak Dr
- 551 E Equinox Peak Ct Unit Homesite 2035
- 551 E Equinox Peak Ct
- 1031 Village Knoll Dr
- 5365 Ebbetts Pass Dr
- 969 Marble Hills Cir
- 7290 Pah Rah Dr
- 6800 Pah Rah Dr Unit 2A
- 7310 Lindsey Ln
- 985 Floral Ridge Way
- 6875 Pah Rah Dr
- 811 Pinchot Pass Ct Unit 5
- 5420 Desert Peach Dr
- 997 Ephedra Ln
- 6560 Pyramid Way Unit 23
- 1196 Turnberry Dr
- 5627 Crescent Hill Way
- 5631 Crescent Hill Way Unit 2
- 0000 Merrilee Way
- 5615 Crescent Hill Way
- 5611 Crescent Hill Way Unit 2
- 5613 Churchill Green Dr
- 5609 Churchill Green Dr
- 5306 Crescent Hill Way
- 5605 Churchill Green Dr
- 5630 Churchill Green Dr
- 5603 Crescent Hill Way
- 5626 Churchill Green Dr
- 5601 Churchill Green Dr
- 5607 Crescent Hill Way
- 5622 Churchill Green Dr
- 5618 Churchill Green Dr
- 5655 Hunting Creek Way
- 5590 Bridger Peak Dr
- 5593 Churchill Green Dr Unit 2
- 5659 Hunting Creek Way