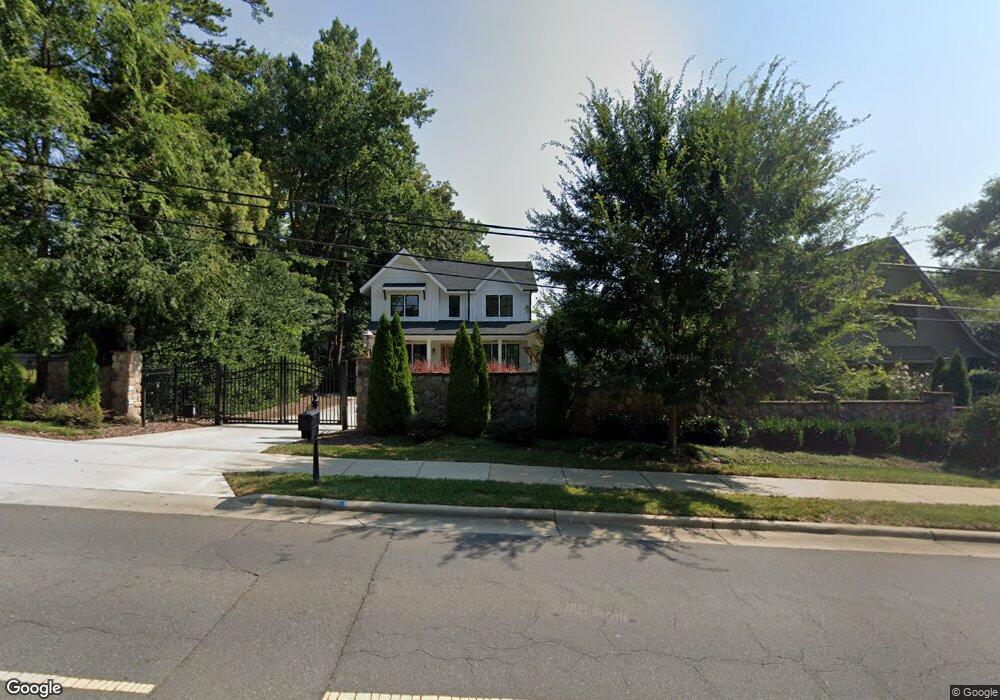
5623 Sharon View Rd Unit 1 Charlotte, NC 28226
Olde Providence NeighborhoodEstimated Value: $1,344,000 - $1,437,000
4
Beds
4
Baths
2,937
Sq Ft
$471/Sq Ft
Est. Value
About This Home
This home is located at 5623 Sharon View Rd Unit 1, Charlotte, NC 28226 and is currently estimated at $1,382,001, approximately $470 per square foot. 5623 Sharon View Rd Unit 1 is a home located in Mecklenburg County with nearby schools including Sharon Elementary, Carmel Middle, and South Mecklenburg High School.
Ownership History
Date
Name
Owned For
Owner Type
Purchase Details
Closed on
Oct 14, 2025
Sold by
Brock Tyler J and Klekamp Jessica
Bought by
Klekamp Jessica
Current Estimated Value
Home Financials for this Owner
Home Financials are based on the most recent Mortgage that was taken out on this home.
Original Mortgage
$654,272
Outstanding Balance
$654,272
Interest Rate
6.5%
Mortgage Type
New Conventional
Estimated Equity
$727,729
Purchase Details
Closed on
Aug 10, 2021
Sold by
Montgomery Thomas Brian and Montgomery Susan Marie
Bought by
Brock Tyler J and Klekamp Jessica
Purchase Details
Closed on
Jun 11, 2019
Sold by
Vernal Equinox Llc
Bought by
Montgomery Thomas Brian and Montgomery Susan Marie
Home Financials for this Owner
Home Financials are based on the most recent Mortgage that was taken out on this home.
Original Mortgage
$809,100
Interest Rate
3.37%
Mortgage Type
New Conventional
Purchase Details
Closed on
Jul 13, 2018
Sold by
Chelsea Building Group Llc
Bought by
Vernal Equinox Llc
Purchase Details
Closed on
Sep 12, 2016
Sold by
Trugurad Llc
Bought by
Chelsea Bulding Ggroup Llc
Purchase Details
Closed on
Nov 4, 2005
Sold by
Dwight Clark Development Llc
Bought by
Vernal Equinox Llc
Create a Home Valuation Report for This Property
The Home Valuation Report is an in-depth analysis detailing your home's value as well as a comparison with similar homes in the area
Home Values in the Area
Average Home Value in this Area
Purchase History
| Date | Buyer | Sale Price | Title Company |
|---|---|---|---|
| Klekamp Jessica | -- | None Listed On Document | |
| Brock Tyler J | $1,050,000 | Investors Title Insurance Co | |
| Montgomery Thomas Brian | $899,000 | None Available | |
| Vernal Equinox Llc | -- | None Available | |
| Chelsea Bulding Ggroup Llc | -- | None Available | |
| Vernal Equinox Llc | $1,190,000 | -- |
Source: Public Records
Mortgage History
| Date | Status | Borrower | Loan Amount |
|---|---|---|---|
| Open | Klekamp Jessica | $654,272 | |
| Previous Owner | Montgomery Thomas Brian | $809,100 |
Source: Public Records
Tax History Compared to Growth
Tax History
| Year | Tax Paid | Tax Assessment Tax Assessment Total Assessment is a certain percentage of the fair market value that is determined by local assessors to be the total taxable value of land and additions on the property. | Land | Improvement |
|---|---|---|---|---|
| 2025 | $9,103 | $1,181,900 | $280,000 | $901,900 |
| 2024 | $9,103 | $1,181,900 | $280,000 | $901,900 |
| 2023 | $7,809 | $1,218,000 | $280,000 | $938,000 |
| 2022 | $7,809 | $796,200 | $325,000 | $471,200 |
| 2021 | $7,683 | $796,200 | $325,000 | $471,200 |
| 2020 | $7,790 | $583,400 | $325,000 | $258,400 |
| 2019 | $5,630 | $583,400 | $325,000 | $258,400 |
| 2018 | $2,755 | $210,000 | $210,000 | $0 |
| 2017 | $2,718 | $210,000 | $210,000 | $0 |
| 2016 | $2,718 | $210,000 | $210,000 | $0 |
| 2015 | $2,718 | $210,000 | $210,000 | $0 |
| 2014 | $2,697 | $0 | $0 | $0 |
Source: Public Records
Map
Nearby Homes
- 6623 Gaywind Dr
- 6200 Old Providence Rd
- 6500 Old Providence Rd
- 2300 Fernbank Dr Unit 38
- 2357 Rock Creek Dr
- 2240 La Maison Dr
- 6614 Old Providence Rd
- 2310 La Maison Dr
- 2618 Whitney Hill Rd
- 2415 La Maison Dr
- 315 Audrey Place Unit 5
- 301 Audrey Place Unit 8
- 305 Audrey Place Unit 7
- 6768 Lynrose Ct
- 6800 Old Providence Rd
- 309 Audrey Place Unit 6
- 401 Audrey Place Unit 3
- 317 Audrey Place Unit 4
- 405 Audrey Place Unit 2
- 409 Audrey Place Unit 1
- 5623 Sharon View Rd
- 5629 Sharon View Rd
- 5564 Holyoke Ln
- 6355 Fair Valley Dr
- 6349 Fair Valley Dr
- 6338 Bentridge Dr
- 6330 Bentridge Dr
- 2303 Coley View Ct
- 6335 Fair Valley Dr
- 5560 Holyoke Ln
- 6322 Bentridge Dr
- 2307 Coley View Ct
- 6325 Fair Valley Dr
- 6314 Bentridge Dr
- 6410 Montvale Ct
- 6408 Montvale Ct
- 6406 Montvale Ct
- 6406 Montvale Ct
- 6406 Montvale Ct Unit 74
- 2301 Summerlake Rd