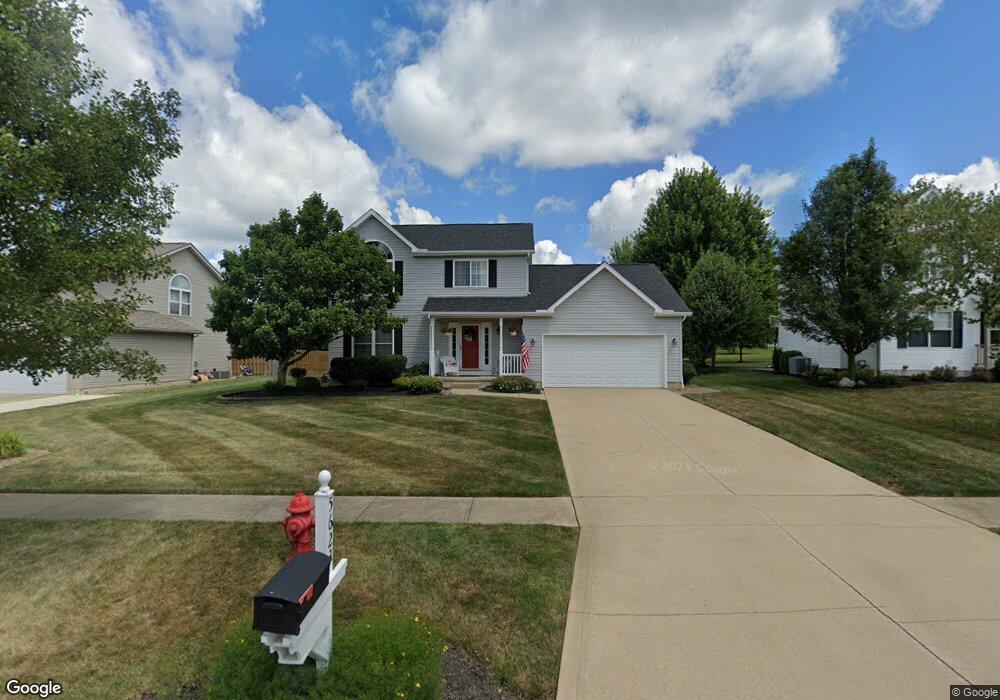
5623 Shawnee Trail Chippewa Lake, OH 44215
Estimated Value: $338,408 - $376,000
3
Beds
3
Baths
1,825
Sq Ft
$197/Sq Ft
Est. Value
About This Home
This home is located at 5623 Shawnee Trail, Chippewa Lake, OH 44215 and is currently estimated at $360,352, approximately $197 per square foot. 5623 Shawnee Trail is a home located in Medina County with nearby schools including Cloverleaf Elementary School, Cloverleaf Middle School, and Cloverleaf High School.
Ownership History
Date
Name
Owned For
Owner Type
Purchase Details
Closed on
Jan 26, 2005
Sold by
Cooper David A and Cooper Amy E
Bought by
Cooper David A and Cooper Amy E
Current Estimated Value
Home Financials for this Owner
Home Financials are based on the most recent Mortgage that was taken out on this home.
Original Mortgage
$155,550
Outstanding Balance
$79,479
Interest Rate
5.83%
Mortgage Type
Purchase Money Mortgage
Estimated Equity
$280,873
Purchase Details
Closed on
Feb 4, 2004
Sold by
Ryan Road Land Corp
Bought by
Foxs Pride Ltd and Portage Pointe
Purchase Details
Closed on
Jul 6, 2001
Sold by
Sweet Briar Homes Inc
Bought by
Cooper David A and Cooper Amy E
Purchase Details
Closed on
Mar 7, 2001
Sold by
Ryan Road Land Corp
Bought by
Sweet Briar Homes Inc
Home Financials for this Owner
Home Financials are based on the most recent Mortgage that was taken out on this home.
Original Mortgage
$118,500
Interest Rate
7.18%
Create a Home Valuation Report for This Property
The Home Valuation Report is an in-depth analysis detailing your home's value as well as a comparison with similar homes in the area
Home Values in the Area
Average Home Value in this Area
Purchase History
| Date | Buyer | Sale Price | Title Company |
|---|---|---|---|
| Cooper David A | $91,500 | Southeast Equity Title Agenc | |
| Foxs Pride Ltd | -- | Title First Agency Inc | |
| Cooper David A | $161,100 | Fidelity National Title Ins | |
| Sweet Briar Homes Inc | $34,000 | -- |
Source: Public Records
Mortgage History
| Date | Status | Borrower | Loan Amount |
|---|---|---|---|
| Open | Cooper David A | $155,550 | |
| Previous Owner | Sweet Briar Homes Inc | $118,500 |
Source: Public Records
Tax History Compared to Growth
Tax History
| Year | Tax Paid | Tax Assessment Tax Assessment Total Assessment is a certain percentage of the fair market value that is determined by local assessors to be the total taxable value of land and additions on the property. | Land | Improvement |
|---|---|---|---|---|
| 2024 | $3,252 | $78,310 | $17,920 | $60,390 |
| 2023 | $3,252 | $78,310 | $17,920 | $60,390 |
| 2022 | $3,273 | $78,310 | $17,920 | $60,390 |
| 2021 | $2,803 | $61,180 | $14,000 | $47,180 |
| 2020 | $2,852 | $61,180 | $14,000 | $47,180 |
| 2019 | $2,866 | $61,180 | $14,000 | $47,180 |
| 2018 | $2,654 | $54,110 | $13,240 | $40,870 |
| 2017 | $2,587 | $54,110 | $13,240 | $40,870 |
| 2016 | $2,488 | $54,110 | $13,240 | $40,870 |
| 2015 | $2,338 | $49,200 | $12,040 | $37,160 |
| 2014 | $2,331 | $49,200 | $12,040 | $37,160 |
| 2013 | $2,162 | $49,200 | $12,040 | $37,160 |
Source: Public Records
Map
Nearby Homes
- 7396 Bittersweet Ln
- 7303 Meadowhaven Dr
- 5829 Heatherhedge Dr
- 7430 Ryan Rd
- 5346 Chippewa Rd
- 7390 Chestnut St
- 5987 Chippewa Rd
- #5 Lot Chippewa Rd
- Lot #6 Chippewa Rd
- Lot #4 Chippewa Rd
- 5735 Overlook Dr
- 6822 Ryan Rd
- 537 Lee Lore Dr
- 7762 Chesterfield Dr
- 7786 Chesterfield Dr
- 5340 Summerwood Dr
- 5101 Maple Heights Dr
- 5626 Burlington Dr
- 0 Winding Woods Trail
- 260 Tanglewood Trail
- 5631 Shawnee Trail
- 5615 Shawnee Trail
- 5605 Shawnee Trail
- 5620 Shawnee Trail
- 5628 Shawnee Trail
- 5597 Shawnee Trail
- 5647 Shawnee Trail
- 5612 Shawnee Trail
- 5604 Shawnee Trail
- 5591 Shawnee Trail
- 5592 Shawnee Trail
- 5636 Chippewa Rd
- 7295 Fayette Blvd
- 5626 Chippewa Rd
- 5626 Chippewa Rd
- 5616 Chippewa Rd
- 5585 Shawnee Trail
- 5646 Chippewa Rd
- 5596 Chippewa Rd
- 5584 Shawnee Trail