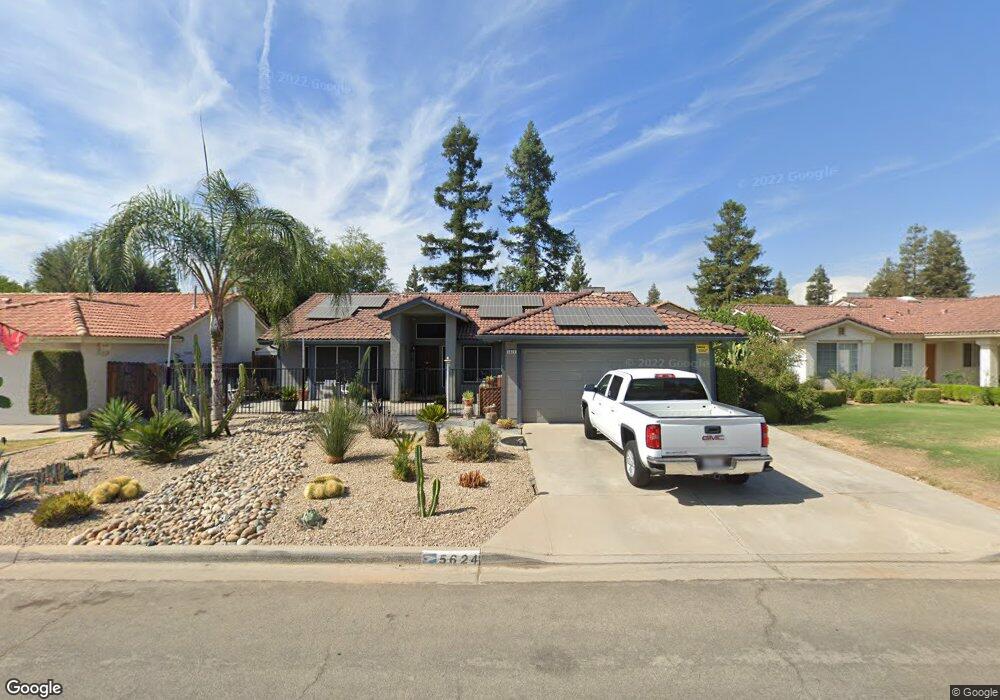
5624 W Fir Ave Fresno, CA 93722
Sierra Sky Park NeighborhoodEstimated Value: $402,000 - $423,000
3
Beds
2
Baths
1,754
Sq Ft
$237/Sq Ft
Est. Value
About This Home
This home is located at 5624 W Fir Ave, Fresno, CA 93722 and is currently estimated at $415,698, approximately $237 per square foot. 5624 W Fir Ave is a home located in Fresno County with nearby schools including River Bluff Elementary School and Rio Vista Middle School.
Ownership History
Date
Name
Owned For
Owner Type
Purchase Details
Closed on
Feb 11, 2022
Sold by
Troncoso 2020 David L and Tron Rebecca
Bought by
Troncoso David L
Current Estimated Value
Purchase Details
Closed on
Jun 4, 2021
Sold by
Troncoso Rebecca C
Bought by
2020 David L And Rebecca C Troncoso Revocable and Tro Rebecca
Purchase Details
Closed on
Aug 19, 2020
Sold by
Troncoso David L and Troncoso Rebecca C
Bought by
2020 David L And Rebecca C Troncoso Revocable and Troncoso
Purchase Details
Closed on
Oct 3, 2017
Sold by
Troncoso David L and Troncoso David L
Bought by
Troncoso David L and Troncoso Rebecca C
Home Financials for this Owner
Home Financials are based on the most recent Mortgage that was taken out on this home.
Original Mortgage
$100,000
Interest Rate
3.86%
Mortgage Type
Credit Line Revolving
Create a Home Valuation Report for This Property
The Home Valuation Report is an in-depth analysis detailing your home's value as well as a comparison with similar homes in the area
Home Values in the Area
Average Home Value in this Area
Purchase History
| Date | Buyer | Sale Price | Title Company |
|---|---|---|---|
| Troncoso David L | -- | None Listed On Document | |
| 2020 David L And Rebecca C Troncoso Revocable | -- | -- | |
| 2020 David L And Rebecca C Troncoso Revocable | -- | None Listed On Document | |
| Troncoso David L | -- | Chicago Title Company |
Source: Public Records
Mortgage History
| Date | Status | Borrower | Loan Amount |
|---|---|---|---|
| Previous Owner | Troncoso David L | $100,000 |
Source: Public Records
Tax History Compared to Growth
Tax History
| Year | Tax Paid | Tax Assessment Tax Assessment Total Assessment is a certain percentage of the fair market value that is determined by local assessors to be the total taxable value of land and additions on the property. | Land | Improvement |
|---|---|---|---|---|
| 2025 | $2,772 | $215,715 | $53,038 | $162,677 |
| 2023 | $2,707 | $207,341 | $50,980 | $156,361 |
| 2022 | $2,557 | $203,277 | $49,981 | $153,296 |
| 2021 | $2,576 | $199,292 | $49,001 | $150,291 |
| 2020 | $2,452 | $197,249 | $48,499 | $148,750 |
| 2019 | $2,415 | $193,383 | $47,549 | $145,834 |
| 2018 | $2,361 | $189,592 | $46,617 | $142,975 |
| 2017 | $2,369 | $185,875 | $45,703 | $140,172 |
| 2016 | $2,187 | $182,231 | $44,807 | $137,424 |
| 2015 | $2,177 | $179,494 | $44,134 | $135,360 |
| 2014 | $2,177 | $175,979 | $43,270 | $132,709 |
Source: Public Records
Map
Nearby Homes
- 7195 N Carnegie Ave
- 5838 W Fallon Ave
- 5804 W Chennault Ave
- 5861 W Parr Ave
- 6675 N Lola Ave
- 5567 W Magill Ave
- 5332 W Millbrae Ave
- 5908 W Fremont Ave
- 6583 N State Ave
- 5811 W Cromwell Ave
- 6189 W Concordia Dr
- 7568 N Hanna Ave
- 7005 N Astoria Dr
- 6203 W Chennault Ave
- 4968 W Pinedale Ave
- 5191 W Wathen Ave
- 5094 W Cromwell Ave
- 5779 W Bluff Ave
- 6294 W Northdale Ave
- 6324 N Wheeler Ave
- 5634 W Fir Ave
- 5614 W Fir Ave
- 5623 W Fallon Ave
- 5644 W Fir Ave
- 5633 W Fallon Ave
- 5613 W Fallon Ave
- 5592 W Fir Ave
- 5619 W Fir Ave
- 5629 W Fir Ave
- 5643 W Fallon Ave
- 5639 W Fir Ave
- 5603 W Fallon Ave
- 5595 W Fir Ave
- 5649 W Fir Ave
- 5622 W Beechwood Ave
- 5583 W Fir Ave
- 5632 W Beechwood Ave
- 5612 W Beechwood Ave
- 7129 N Lola Ave
- 7139 N Lola Ave