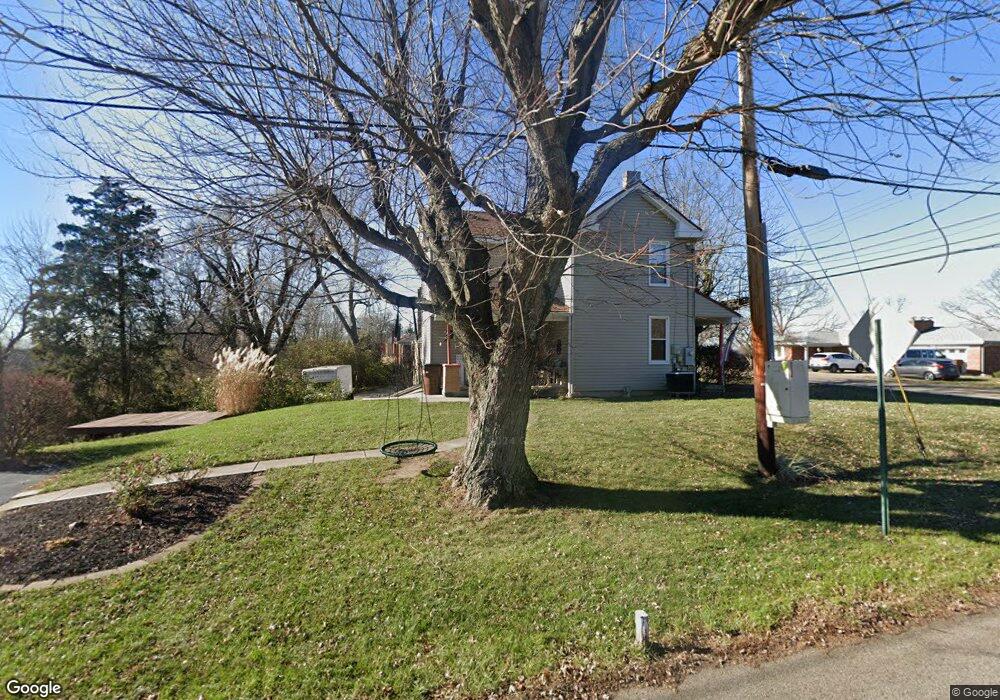
5625 Dry Ridge Rd Cincinnati, OH 45252
Estimated Value: $226,517 - $279,000
3
Beds
1
Bath
1,408
Sq Ft
$180/Sq Ft
Est. Value
About This Home
This home is located at 5625 Dry Ridge Rd, Cincinnati, OH 45252 and is currently estimated at $253,879, approximately $180 per square foot. 5625 Dry Ridge Rd is a home located in Hamilton County with nearby schools including Colerain Elementary School, Colerain Middle School, and Colerain High School.
Ownership History
Date
Name
Owned For
Owner Type
Purchase Details
Closed on
Jun 27, 2017
Sold by
Bayliss Joel B
Bought by
Bayliss Clarice L
Current Estimated Value
Home Financials for this Owner
Home Financials are based on the most recent Mortgage that was taken out on this home.
Original Mortgage
$139,650
Outstanding Balance
$116,255
Interest Rate
4.05%
Mortgage Type
New Conventional
Estimated Equity
$137,624
Purchase Details
Closed on
Jun 23, 2017
Sold by
Bayliss Clarice L
Bought by
Byers Heather M and Lyons Terrence M
Home Financials for this Owner
Home Financials are based on the most recent Mortgage that was taken out on this home.
Original Mortgage
$139,650
Outstanding Balance
$116,255
Interest Rate
4.05%
Mortgage Type
New Conventional
Estimated Equity
$137,624
Purchase Details
Closed on
Nov 20, 2009
Sold by
Richards Wayne G and Richards Veronica A
Bought by
Bayliss Joel B and Bayliss Clarice L
Home Financials for this Owner
Home Financials are based on the most recent Mortgage that was taken out on this home.
Original Mortgage
$113,113
Interest Rate
5.11%
Mortgage Type
VA
Create a Home Valuation Report for This Property
The Home Valuation Report is an in-depth analysis detailing your home's value as well as a comparison with similar homes in the area
Home Values in the Area
Average Home Value in this Area
Purchase History
| Date | Buyer | Sale Price | Title Company |
|---|---|---|---|
| Bayliss Clarice L | -- | None Available | |
| Byers Heather M | $147,000 | None Available | |
| Bayliss Joel B | $109,500 | Prominent Title |
Source: Public Records
Mortgage History
| Date | Status | Borrower | Loan Amount |
|---|---|---|---|
| Open | Byers Heather M | $139,650 | |
| Previous Owner | Bayliss Joel B | $113,113 |
Source: Public Records
Tax History Compared to Growth
Tax History
| Year | Tax Paid | Tax Assessment Tax Assessment Total Assessment is a certain percentage of the fair market value that is determined by local assessors to be the total taxable value of land and additions on the property. | Land | Improvement |
|---|---|---|---|---|
| 2024 | $3,454 | $64,666 | $15,148 | $49,518 |
| 2023 | $3,474 | $64,666 | $15,148 | $49,518 |
| 2022 | $3,387 | $51,451 | $14,893 | $36,558 |
| 2021 | $3,356 | $51,451 | $14,893 | $36,558 |
| 2020 | $3,391 | $51,451 | $14,893 | $36,558 |
| 2019 | $2,147 | $30,370 | $12,621 | $17,749 |
| 2018 | $1,926 | $30,370 | $12,621 | $17,749 |
| 2017 | $1,825 | $30,370 | $12,621 | $17,749 |
| 2016 | $2,215 | $36,411 | $12,709 | $23,702 |
| 2015 | $2,236 | $36,411 | $12,709 | $23,702 |
| 2014 | $2,240 | $36,411 | $12,709 | $23,702 |
| 2013 | $2,244 | $38,325 | $13,377 | $24,948 |
Source: Public Records
Map
Nearby Homes
- 10046 Brehm Rd
- 10034 Brehm Rd
- 9897 Skyridge Dr
- 5576 Sheits Rd
- 9908 Pebbleknoll Dr
- 5077 Pebblevalley Dr
- 10232 Roppelt Rd
- 9873 Kittywood Dr
- 10054 Prechtel Rd
- 9940 Prechtel Rd
- 5567 Day Rd
- 9858 Prechtel Rd
- 9901 Regatta Dr
- 9905 Regatta Dr
- 4352 Courageous Cir Unit 59
- 4302 Courageous Cir Unit 83
- 9940 Regatta Dr
- 4280 Defender Dr
- 4200 Endeavor Dr
- 4198 Intrepid Dr
- 5629 Dry Ridge Rd
- 5633 Dry Ridge Rd
- 10090 Skyridge Dr
- 5630 Dry Ridge Rd
- 5637 Dry Ridge Rd
- 5609 Dry Ridge Rd
- 5640 Dry Ridge Rd
- 5641 Dry Ridge Rd
- 10062 Skyridge Dr
- 5605 Dry Ridge Rd
- 10049 Skyridge Dr
- 5645 Dry Ridge Rd
- A Dry Ridge Rd
- 5.25ac Dry Ridge Rd
- 5802 Dry Ridge Rd
- 6044 Dry Ridge Rd
- 0 Dry Ridge Rd Unit 728234
- 0 Dry Ridge Rd
- 5856 Dry Ridge Rd
- 5270 Dry Ridge Rd