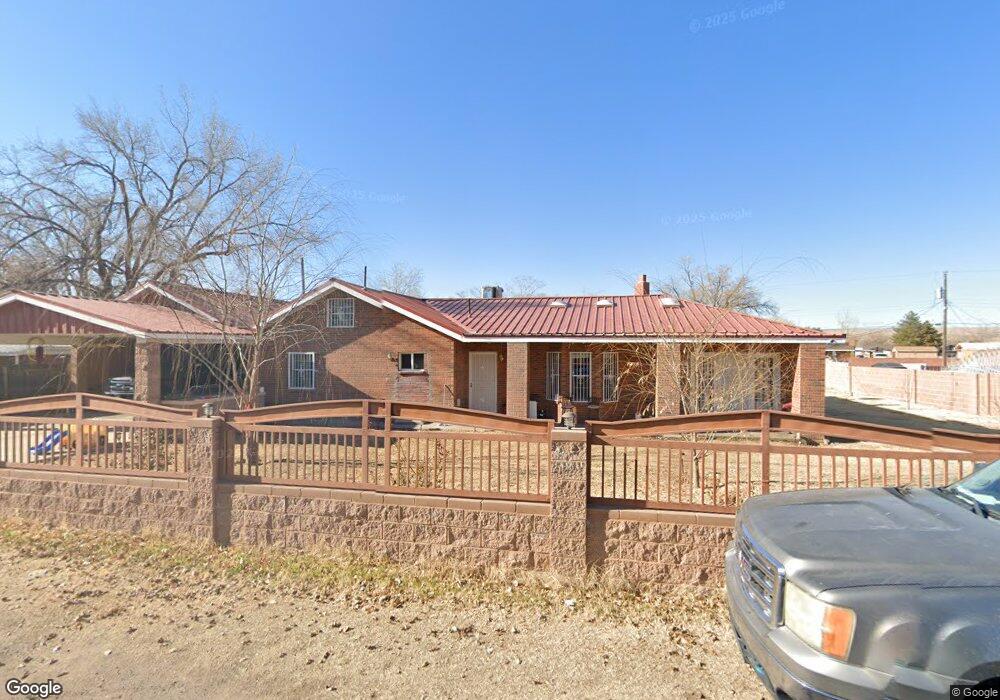
5625 Greer Loop SW Albuquerque, NM 87105
Estimated Value: $311,000 - $429,000
4
Beds
2
Baths
2,185
Sq Ft
$169/Sq Ft
Est. Value
About This Home
This home is located at 5625 Greer Loop SW, Albuquerque, NM 87105 and is currently estimated at $369,679, approximately $169 per square foot. 5625 Greer Loop SW is a home located in Bernalillo County with nearby schools including Pajarito Elementary School, Polk Middle School, and Harrison Middle School.
Ownership History
Date
Name
Owned For
Owner Type
Purchase Details
Closed on
Mar 30, 2005
Sold by
Sanchez Jose Issa and Issa Sonia Guadalupe
Bought by
Anchondo Miquel A and Anchondo Camerina
Current Estimated Value
Home Financials for this Owner
Home Financials are based on the most recent Mortgage that was taken out on this home.
Original Mortgage
$150,350
Outstanding Balance
$76,728
Interest Rate
5.71%
Mortgage Type
Purchase Money Mortgage
Estimated Equity
$292,951
Purchase Details
Closed on
Oct 31, 2002
Sold by
Sanchez Jose Issa
Bought by
Sanchez Jose Issa and Issa Sonia Guadalupe
Home Financials for this Owner
Home Financials are based on the most recent Mortgage that was taken out on this home.
Original Mortgage
$124,033
Interest Rate
6.01%
Mortgage Type
FHA
Create a Home Valuation Report for This Property
The Home Valuation Report is an in-depth analysis detailing your home's value as well as a comparison with similar homes in the area
Home Values in the Area
Average Home Value in this Area
Purchase History
| Date | Buyer | Sale Price | Title Company |
|---|---|---|---|
| Anchondo Miquel A | -- | Fidelity National Title Co | |
| Sanchez Jose Issa | -- | First American Title Ins Co | |
| Sanchez Jose Issa | -- | First American Title Ins Co |
Source: Public Records
Mortgage History
| Date | Status | Borrower | Loan Amount |
|---|---|---|---|
| Open | Anchondo Miquel A | $150,350 | |
| Previous Owner | Sanchez Jose Issa | $124,033 |
Source: Public Records
Tax History
| Year | Tax Paid | Tax Assessment Tax Assessment Total Assessment is a certain percentage of the fair market value that is determined by local assessors to be the total taxable value of land and additions on the property. | Land | Improvement |
|---|---|---|---|---|
| 2025 | $1,985 | $53,330 | $23,343 | $29,987 |
| 2024 | $1,922 | $51,777 | $22,663 | $29,114 |
| 2023 | $1,887 | $50,269 | $22,003 | $28,266 |
| 2022 | $1,776 | $48,806 | $21,363 | $27,443 |
| 2021 | $1,718 | $47,384 | $20,741 | $26,643 |
| 2020 | $1,687 | $46,004 | $20,137 | $25,867 |
| 2019 | $1,638 | $44,664 | $19,550 | $25,114 |
| 2018 | $1,580 | $44,664 | $19,550 | $25,114 |
| 2017 | $1,521 | $43,364 | $18,981 | $24,383 |
| 2016 | $1,465 | $40,876 | $17,892 | $22,984 |
| 2015 | $39,685 | $39,685 | $17,371 | $22,314 |
| 2014 | $1,355 | $38,530 | $16,865 | $21,665 |
| 2013 | -- | $38,829 | $16,865 | $21,964 |
Source: Public Records
Map
Nearby Homes
- 5726 Wood Rd SW
- 5732 Wood Rd SW
- 0 Coors Rd SW
- 0 Off Pajarito (Wf 9 11 12) Rd SW Unit 1057983
- 5809 Warren Ln SW
- 2716 Apple Valley Ave SW
- 4630 Valley Garden Dr SW
- 2216 Pajarito Parcel 2 Rd SW
- 2216 Pajarito Parcel 1 Rd SW
- 4537 W Lea Dr SW
- 2813 Desert Garden Ln SW
- 6105 Molinero Ct SW
- 2620 Gun Club Rd SW
- 0 Off Pajarito (N9) Rd SW Unit 1018827
- 0 Pajarito and Douglass Rd SW Unit 1039459
- 3730 Lisa Rd SW
- 6327 Isleta Blvd SW
- 0 Douglas (N26) Rd SW Unit 1020092
- 1221 Coors Blvd SW
- 5757 Maplewood (N28) Ave SW
- 5631 Greer Loop SW
- 5619 Greer Loop SW
- 5630 Greer Loop SW
- 5624 Greer Loop SW
- 5636 Greer Loop SW
- 5637 Greer Loop SW
- 5642 Greer Loop SW
- 5613 Greer Loop SW
- 5624 Cletsoway Dr SW
- 5618 Greer Loop SW
- 5630 Cletsoway Dr SW
- 5636 Cletsoway Dr SW
- 5648 Greer Loop SW
- 5643 Greer Loop SW
- 5608 Greer Loop SW
- 5612 Cletsoway Dr SW
- 5642 Cletsoway Dr SW
- 5647 Wood Rd SW
- 5650 Greer Loop SW
- 5606 Cletsoway Dr SW
Your Personal Tour Guide
Ask me questions while you tour the home.