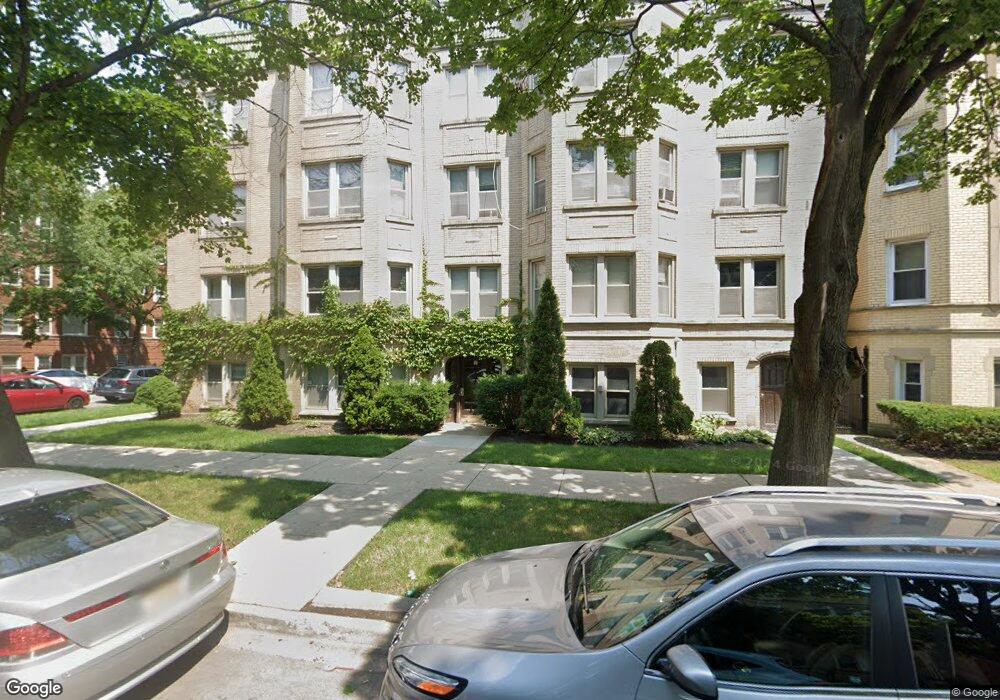
5625 N Spaulding Ave Unit 5625 Chicago, IL 60659
North Park NeighborhoodEstimated Value: $227,962 - $268,000
3
Beds
1
Bath
1,200
Sq Ft
$204/Sq Ft
Est. Value
About This Home
This home is located at 5625 N Spaulding Ave Unit 5625, Chicago, IL 60659 and is currently estimated at $244,241, approximately $203 per square foot. 5625 N Spaulding Ave Unit 5625 is a home located in Cook County with nearby schools including Peterson Elementary School, Mather High School, and ICC School.
Ownership History
Date
Name
Owned For
Owner Type
Purchase Details
Closed on
Nov 5, 2020
Sold by
Flawless Homes Llc
Bought by
Huynh Victor
Current Estimated Value
Home Financials for this Owner
Home Financials are based on the most recent Mortgage that was taken out on this home.
Original Mortgage
$160,455
Outstanding Balance
$143,292
Interest Rate
3%
Mortgage Type
New Conventional
Estimated Equity
$100,949
Purchase Details
Closed on
Feb 25, 2020
Sold by
Debaz Elias
Bought by
Flawless Homes Llc
Home Financials for this Owner
Home Financials are based on the most recent Mortgage that was taken out on this home.
Original Mortgage
$132,500
Interest Rate
3.6%
Mortgage Type
Construction
Purchase Details
Closed on
Aug 16, 2007
Sold by
5621 N Spaulding Development Llc
Bought by
Debaz Elias
Home Financials for this Owner
Home Financials are based on the most recent Mortgage that was taken out on this home.
Original Mortgage
$161,600
Interest Rate
6.79%
Mortgage Type
New Conventional
Create a Home Valuation Report for This Property
The Home Valuation Report is an in-depth analysis detailing your home's value as well as a comparison with similar homes in the area
Home Values in the Area
Average Home Value in this Area
Purchase History
| Date | Buyer | Sale Price | Title Company |
|---|---|---|---|
| Huynh Victor | $169,000 | Chicago Title | |
| Flawless Homes Llc | $110,000 | Cambridge Title Company | |
| Debaz Elias | $202,000 | Chicago Title Insurance Co |
Source: Public Records
Mortgage History
| Date | Status | Borrower | Loan Amount |
|---|---|---|---|
| Open | Huynh Victor | $160,455 | |
| Previous Owner | Flawless Homes Llc | $132,500 | |
| Previous Owner | Debaz Elias | $161,600 |
Source: Public Records
Tax History Compared to Growth
Tax History
| Year | Tax Paid | Tax Assessment Tax Assessment Total Assessment is a certain percentage of the fair market value that is determined by local assessors to be the total taxable value of land and additions on the property. | Land | Improvement |
|---|---|---|---|---|
| 2024 | $3,100 | $18,493 | $1,767 | $16,726 |
| 2023 | $3,022 | $14,642 | $1,413 | $13,229 |
| 2022 | $3,022 | $14,642 | $1,413 | $13,229 |
| 2021 | $2,954 | $14,641 | $1,413 | $13,228 |
| 2020 | $2,713 | $12,138 | $731 | $11,407 |
| 2019 | $2,734 | $13,564 | $731 | $12,833 |
| 2018 | $2,688 | $13,564 | $731 | $12,833 |
| 2017 | $3,655 | $16,923 | $656 | $16,267 |
| 2016 | $3,401 | $16,923 | $656 | $16,267 |
| 2015 | $4,566 | $24,830 | $656 | $24,174 |
| 2014 | $2,697 | $14,485 | $605 | $13,880 |
| 2013 | $2,644 | $14,485 | $605 | $13,880 |
Source: Public Records
Map
Nearby Homes
- 5621 N Spaulding Ave Unit 3
- 5655 N Spaulding Ave Unit 2W
- 5657 N Spaulding Ave Unit 1A
- 5914 N Lincoln Ave Unit 1E
- 5627 N Kimball Ave Unit 3B
- 3240 W Victoria St
- 5715 N Kimball Ave Unit 1N
- 5638 N Kimball Ave
- 5717 N Kimball Ave Unit 2N
- 5815 N Spaulding Ave Unit 2B
- 5807 N Bernard St
- 5706 N Saint Louis Ave
- 5645 N Virginia Ave
- 5359 N Spaulding Ave
- 5351 N Kimball Ave
- 5848 N Virginia Ave
- 5910 N Kimball Ave
- 5807 N Sacramento Ave
- 3550 W Ardmore Ave
- 5838 N Sacramento Ave
- 3253 N Spaulding Ave Unit 3W
- 3253 N Spaulding Ave Unit 3
- 3253 Spaulding
- 3257 Spaulding
- 3259 Spaulding
- 5621 N Spaulding Ave Unit 5621
- 5621 N Spaulding Ave Unit 5621
- 5621 N Spaulding Ave Unit 5621
- 5621 N Spaulding Ave Unit 2
- 5621 N Spaulding Ave Unit 1
- 5621 N Spaulding Ave Unit 2S
- 5621 N Spaulding Ave Unit 1S
- 5625 N Spaulding Ave Unit 1N
- 5625 N Spaulding Ave Unit 5625
- 5625 N Spaulding Ave Unit 5625
- 5625 N Spaulding Ave Unit 5625
- 5625 N Spaulding Ave Unit G
- 5625 N Spaulding Ave Unit 1
- 5625 N Spaulding Ave Unit 3N
- 5625 N Spaulding Ave Unit 2N