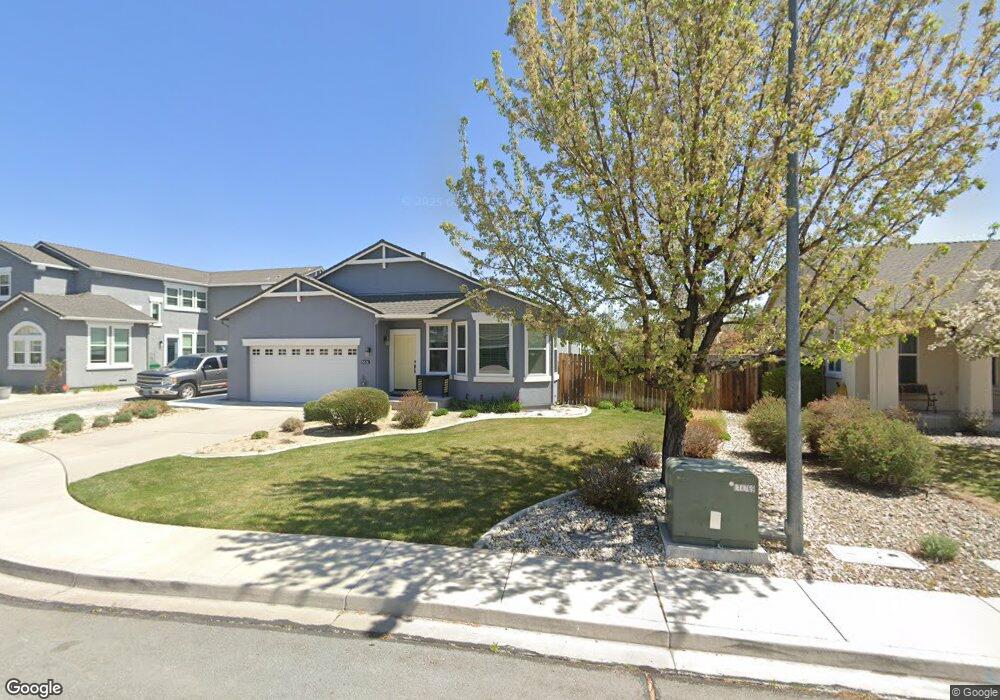
5626 Bridger Peak Ct Sparks, NV 89436
Sparks Galleria NeighborhoodEstimated Value: $504,330 - $544,000
3
Beds
2
Baths
1,739
Sq Ft
$298/Sq Ft
Est. Value
About This Home
This home is located at 5626 Bridger Peak Ct, Sparks, NV 89436 and is currently estimated at $518,583, approximately $298 per square foot. 5626 Bridger Peak Ct is a home located in Washoe County with nearby schools including Miguel Sepulveda Elementary School, Sky Ranch Middle School, and Edward C Reed High School.
Ownership History
Date
Name
Owned For
Owner Type
Purchase Details
Closed on
Mar 2, 2021
Sold by
Jordan Vivian
Bought by
Jordan Vivian L and Vivian L Jordan Revocable Trus
Current Estimated Value
Purchase Details
Closed on
Nov 16, 2011
Sold by
Betts Derek and Betts Sherrie
Bought by
Jordan Vivian
Home Financials for this Owner
Home Financials are based on the most recent Mortgage that was taken out on this home.
Original Mortgage
$146,684
Outstanding Balance
$99,774
Interest Rate
4.12%
Mortgage Type
FHA
Estimated Equity
$418,809
Purchase Details
Closed on
Jul 27, 2004
Sold by
Barker Coleman Construction Llc
Bought by
Betts Derek and Betts Sherrie
Home Financials for this Owner
Home Financials are based on the most recent Mortgage that was taken out on this home.
Original Mortgage
$240,000
Interest Rate
3.75%
Mortgage Type
New Conventional
Create a Home Valuation Report for This Property
The Home Valuation Report is an in-depth analysis detailing your home's value as well as a comparison with similar homes in the area
Home Values in the Area
Average Home Value in this Area
Purchase History
| Date | Buyer | Sale Price | Title Company |
|---|---|---|---|
| Jordan Vivian L | -- | None Available | |
| Jordan Vivian | $150,500 | Ticor Title Reno | |
| Betts Derek | $300,000 | Ticor Title Of Nevada Inc |
Source: Public Records
Mortgage History
| Date | Status | Borrower | Loan Amount |
|---|---|---|---|
| Open | Jordan Vivian | $146,684 | |
| Previous Owner | Betts Derek | $240,000 | |
| Closed | Betts Derek | $45,000 |
Source: Public Records
Tax History Compared to Growth
Tax History
| Year | Tax Paid | Tax Assessment Tax Assessment Total Assessment is a certain percentage of the fair market value that is determined by local assessors to be the total taxable value of land and additions on the property. | Land | Improvement |
|---|---|---|---|---|
| 2026 | $1,895 | $103,443 | $31,327 | $72,116 |
| 2025 | $2,461 | $106,520 | $33,170 | $73,351 |
| 2024 | $2,461 | $101,265 | $27,405 | $73,860 |
| 2023 | $2,391 | $103,410 | $33,450 | $69,960 |
| 2022 | $2,321 | $83,845 | $25,636 | $58,210 |
| 2021 | $2,255 | $80,117 | $22,145 | $57,972 |
| 2020 | $2,186 | $79,648 | $21,613 | $58,035 |
| 2019 | $2,124 | $77,439 | $21,347 | $56,092 |
| 2018 | $2,061 | $70,231 | $15,461 | $54,770 |
| 2017 | $2,002 | $69,685 | $14,896 | $54,789 |
| 2016 | $1,951 | $69,769 | $13,766 | $56,003 |
| 2015 | $1,947 | $69,182 | $13,333 | $55,849 |
| 2014 | $1,890 | $63,852 | $10,108 | $53,744 |
| 2013 | -- | $50,575 | $8,412 | $42,163 |
Source: Public Records
Map
Nearby Homes
- 5707 Rainier Peak Dr
- 5575 Junction Peak Dr
- 551 E Equinox Peak Ct Unit Homesite 2035
- 551 E Equinox Peak Ct
- 601 W Equinox Peak Ct Unit Homesite 2030
- 601 W Equinox Peak Ct
- 7290 Pah Rah Dr
- 2084 Great Bluffs Ln Unit Homesite 5132
- 7310 Lindsey Ln
- 969 Marble Hills Cir
- 985 Floral Ridge Way
- 6875 Pah Rah Dr
- 6800 Pah Rah Dr Unit 2A
- 5365 Ebbetts Pass Dr
- 35 Roxy Ct
- 1031 Village Knoll Dr
- 756 Iron Stirrup Ct
- 811 Pinchot Pass Ct Unit 5
- 6560 Pyramid Way Unit 23
- 1736 Eagle Pass Rd Unit Homesite 1114
- 5616 Bridger Peak Ct
- 5636 Bridger Peak Ct
- 5606 Bridger Peak Ct
- 5646 Bridger Peak Ct
- 5621 Bridger Peak Ct Unit Ct.
- 5611 Bridger Peak Ct
- 5631 Bridger Peak Ct
- 5696 Sonora Pass Dr
- 5601 Bridger Peak Ct
- 5686 Sonora Pass Dr
- 5663 Hunting Creek Way
- 5659 Hunting Creek Way
- 5676 Sonora Pass Dr
- 5616 Cathedral Peak Dr
- 5626 Cathedral Peak Dr
- 5606 Cathedral Peak Dr
- 5636 Cathedral Peak Dr
- 5594 Bridger Peak Dr
- 5662 Hunting Creek Way
- 5664 Cathedral Peak Dr